| ||||||||||||
| ||||||||||||
|
Wednesday, December 20, 2017
Building the Case for Public Statistics, March 8 in DC


Tuesday, December 19, 2017
2017’s Most Charitable States

Tis the season for giving. And the latest World Giving Index shows that Americans are among the world’s most generous people, ranking No. 5 out of 140 countries. U.S. donors in 2016 gave more than $389 billion to charity, with 72 percent of the funds coming directly from individuals, according to the National Philanthropic Trust.
But Americans do more than reach in their pockets to help others. They also contribute their time — and plenty of it. Nearly 63 million people volunteer in the U.S., serving a combined total of 7.9 billion hours per year, the equivalent of $184 billion of service.
Not everyone is equally selfless, however. In the spirit of inspiring altruism, WalletHub determined the most charitable of the 50 states by comparing them across 14 key indicators of charitable behavior. Our dataset ranges from volunteer rate to share of income donated to share of sheltered homeless.
Monday, December 18, 2017
2016 Annual Survey of Manufactures and other reports
The 2016 Annual Survey of Manufactures (ASM) release includes general statistics, value of products shipments, industry-product analysis and geographic area statistics for 2015 and 2016. The ASM provides data about manufacturing that are crucial to accurate estimates of domestic production and productivity and to making sound decisions on economic trade policies. Companies, business analysts and trade associations use this data in planning investments, production and marketing.
This report presents data at the two- through six-digit North American Industry Classification System (NAICS) levels on employment, payroll, cost of materials, operating expenses, shipments and receipts for services, value added, and inventories.
This report presents product shipment statistics at the six-digit NAICS level and seven-digit NAICS product class level.

Presents value of shipments, including miscellaneous receipts, at the six-digit NAICS level by three-digit product code levels.
These reports present manufacturing statistics by state at the two- through four-digit NAICS levels and supplemental statistics for the United States and states at the two-digit NAICS level.
Saturday, December 16, 2017
High School Completion Rate Is Highest in U.S. History

For the first time in U.S. history, 90 percent of the population age 25 and older have completed high school. This is according to new Educational Attainment data released by the U.S. Census Bureau.
“In 1940, less than half of the population age 25 and older had a high school diploma. Over the years this has increased to the point where we now have 90 percent who have completed high school,” said Kurt Bauman, a demographer in the Social, Economic and Housing Statistics Division. “That means out of the 217 million people age 25 and older, 194 million have a high school diploma or higher.”
Between 2000 and 2017, the percentage of all people age 25 and older who had not completed high school decreased by more than one-third, dropping from 16 percent to 10 percent.
As high school educational attainment increased for the nation as a whole, attainment for minority populations also increased. Over the same time period, the percentage of blacks age 25 and older who had completed high school increased by 9 percentage points from 78 percent to 87 percent. The percentage of Hispanics age 25 and older who had completed high school increased by approximately 13 percentage points from 57 percent to 71 percent in the same time period. Non-Hispanic whites increased their high school completion 6 percentage points, from 88 percent to 94 percent.
Additionally, the increase in educational attainment goes beyond high school. The rate of attainment for a bachelor’s degree or higher increased from about 26 percent in 2000 to approximately 34 percent in 2017, an increase of 9 percentage points. Attainment of a bachelor’s degree or higher was greater for females age 25 and older (35 percent) than it was for males (34 percent). Of females between the ages of 25 and 34, 41 percent had attained a bachelor’s degree or higher.
More highlights:
· Asians were most likely to have at least a bachelor’s degree, with a rate of 55 percent for those age 25 and older. Among non-Hispanic whites, the rate was 38 percent. Among blacks, the rate was 24 percent. Among Hispanics of any race group age 25 and older, 17 percent had a bachelor’s degree or higher.
· Since 2000, the number of master’s degree holders has doubled to 21 million and the number of doctoral degree holders has doubled to 4 million.
· People with advanced degrees make up 13 percent of all U.S. adults, the percentage of the population that had a bachelor’s degree or higher in 1973.
· In 2017, 14 percent of immigrants to the United States held master’s, professional and doctoral degrees as compared to 13 percent of U.S. natives. To learn more about immigrant educational attainment, check out the Immigrant Families and Educational Attainment blog.
· College attainment of the population age 55 and older grew from 19 percent in 2000 to 30 percent in 2017. Part of this is accounted for by the aging of the baby-boom generation, which now makes up 70 percent of the population age 55 and older.
· From 2010 to 2016, mean earnings for workers with less than a high school education grew by 21 percent to $27,800. Other levels of education also saw increases in their earnings between 2010 and 2016. Earnings in 2016 for workers with a high school diploma or equivalent was $36,700, workers with a bachelor’s degree earned $67,300, and advanced degree holders earned $95,200.
The Current Population Survey, sponsored jointly by the Census Bureau and the U.S. Bureau of Labor Statistics, is the primary source of labor force statistics for the population of the United States.
###
|
Friday, December 15, 2017
The Unstoppable Growth of Fantasy Sports [Infographic]

Fantasy sports is a phenomenal business that has grown into a billion-dollar industry. One of the reasons behind the popularity of fantasy sports is the fact that fans feel like they have a real stake in the performance of their players and teams.
Sports lovers like to see themselves as strategists, as they create a fantasy football, basketball, baseball, or hockey team. They can trade players, adjust their team, and execute their best course of action. Fantasy players pay an entry fee ranging from $50-$100, leading to an average of $465 per player, annually. With their money on the line, players have an even bigger desire to win, which extends beyond watching an actual gameplay. This also adds to the huge money prizes that reach up to $2 billion.
Fantasy sports have changed the sports experience. Leagues and networks note increased viewership and fans are given the opportunity to get more involved in their favourite sport.
***
[I'm fascinated by this, since I've never participated personally, and don't "get" it.]
Tuesday, December 12, 2017
With 2020 Census Looming, Worries About Fairness and Accuracy
From the New York Times:
 Census experts and public officials are expressing growing concerns that the bedrock mission of the 2020 census — an accurate and trustworthy head count of everyone in the United States — is imperiled, with worrisome implications.
Preparations for the count already are complicated by a sea change in the census itself: For the first time, it will be conducted largely online instead of by mail.
But as the Census Bureau ramps up its spending and workforce for the 2020 count, it is saddled with problems. Its two top administrative posts are filled by placeholders. Years of underfunding by Congress and cost overruns on the digital transition have forced the agency to pare back its preparations, including abandoning two of the three trial runs of the overhauled census process.
Civil liberties advocates also fear that the Trump administration is injecting political considerations into the bureau, a rigidly nonpartisan agency whose population count will be the basis for redrawing congressional and state legislative districts in the early 2020s. And there is broad agreement that the administration’s aggressive enforcement of immigration policies will make it even harder to reach minorities, undocumented immigrants and others whose numbers have long been undercounted.
Taken together, some experts say, those issues substantially raise the risk that the 2020 count could be flawed, disputed, or both.
Monday, December 11, 2017
Debt in America: An Interactive Map

Credit can be a lifeline during emergencies and a bridge to education and homeownership. But debt—which can stem from credit or unpaid bills—often burdens families and communities and exacerbates wealth inequality. This map shows the geography of debt in America at the national, state, and county levels. How does your community compare?
This dashboard contains 2016 data derived from a random sample of deidentified, consumer-level records from a major credit bureau, as well as estimates from summary tables of the US Census Bureau’s American Community Survey (2015 or 2011–15).
We define the nonwhite population as those who are African American, Hispanic, Asian or Pacific Islander, American Indian or Alaska Native, another race, or multiracial.
Debt in collections includes past-due credit lines that have been closed and charged-off on their books as well as unpaid bills reported to the credit bureaus that the creditor is attempting to collect. For example, credit card accounts enter collections status once they are 180 days past due.
Friday, December 8, 2017
Commuting, Median Rents and Language Other Than English
New American Community Survey Statistics Provide Local Data for Every Community Nationwide
DEC. 7, 2017 — The nation experienced an increase in commuting times and median gross rent along with a rise in English proficiency among those who spoke another language. These are only a few of the statistics released today from the U.S. Census Bureau’s 2012-2016 American Community Survey five-year estimates, which features more than 40 social, economic, housing and demographic topics, including homeowner rates and costs, health insurance and educational attainment.
“The American Community Survey allows us to track incremental changes across our nation on how people live and work, year-to-year,” said David Waddington, chief of the Social, Economic, and Housing Statistics Division. “It’s our country’s only source of small area estimates for socio-economic and demographic characteristics. These estimates help people, businesses and governments throughout the country better understand the needs of their populations, the markets in which they operate and the challenges and opportunities they face.”
The survey produces statistics for all of the nation’s 3,142 counties. In addition, it is the only full dataset available for three-fourths of all counties with populations too small to produce a complete set of single-year statistics (2,322 counties). Each year, Census Bureau data helps determine how more than $675 billion of federal funding are spent on infrastructure and services, from highways to schools to hospitals.
Data Highlights
The following highlights are from the 2012-2016 American Community Survey five-year estimates release, unless otherwise noted.
Commuting Characteristics
Between 2012 and 2016, the average commute time for the nation was 26.1 minutes, an increase of 0.7 minutes from 25.4 minutes in the 2007-2011 American Community Survey five-year estimates data.
· The longest average one-way travel times are generally associated with larger metro areas or smaller metro areas within commuting distance of a larger metro area. Among the longest were:
o East Stroudsburg, Pa., metropolitan area (38.6 minutes).
o New York-Newark-Jersey City, N.Y.-N.J.-Pa., metropolitan area (35.9 minutes).
o Washington-Arlington-
· The shortest average one-way travel times are usually associated with smaller metro areas. Among the shortest were:
o Walla Walla, Wash., metropolitan area (15.4 minutes).
o Grand Forks, N.D.-Minn., metropolitan area (15.5 minutes).
o Great Falls, Mont., metropolitan area (15.6 minutes).
The travel times for Walla Walla, Grand Forks and Great Falls metro areas are not statistically different from each other.
· About 7.5 million workers (5.1 percent) commute by bus, subway, commuter rail, light rail or some other form of public transportation on a typical workday. Public transportation usage is highly concentrated within the nation’s large metro areas.
· Among metro areas with high rates of public transportation commuting:
o The New York-Northern New Jersey-Long Island, N.Y.-N.J.-Pa., metropolitan area stands out with 31.0 percent of workers (2,918,906 people) commuting by transit.
o The San Francisco-Oakland-Hayward, Calif., metropolitan area and the Washington-Arlington-
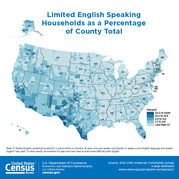
Language Spoken at Home and English-Speaking Ability
Between 2012 and 2016, 21.1 percent (63,172,059) of the population age 5 and older spoke a language other than English at home, an increase from 20.3 percent in the 2007-2011 American Community Survey five-year estimates data.
· Of those who spoke a language other than English at home, 59.7 percent (37,731,103) also spoke English “very well.” This proportion increased from 57.1 percent in 2007-2011.
· New data for five languages are available on American Fact Finder Table B16001: Haitian, Punjabi, Bengali, Telugu and Tamil.
o There were 806,254 people ages 5 and older who spoke Haitian at home. Almost half (48.8 percent) lived in Florida.
o Of the 280,867 people ages 5 and older who spoke Punjabi at home, 48.0 percent lived in California.
o Of the 259,204 people ages 5 and older who spoke Bengali at home, 38.6 percent lived in New York.
o The 321,695 people ages 5 and older who spoke Telugu at home and the 238,699 people speaking Tamil at home were more evenly distributed across many parts of the nation. For both languages, the highest concentration of speakers lived in California, followed by Texas and New Jersey (the number of persons who spoke Tamil in Texas and New Jersey are not statistically different).
Median Gross Rent
The United States experienced a $21 increase in median gross rent — from $928 in 2007-2011 (adjusted for inflation), to $949 in 2012-2016.
· The 50 most populous metropolitan areas had increases in median gross rent that outnumbered decreases four to one. There were 32 increases, eight decreases and nine that had no change from 2007-2011 data. (Comparisons for the Los Angeles-Long Beach-Anaheim, Calif., metropolitan area cannot be made due to boundary changes.)
· Of the 551 micropolitan areas, 146 changed, increases outnumbering decreases two to one with 107 increases and 39 decreases.
Income
· Of the 3,142 counties in the United States, 563 counties (17.9 percent) experienced a decline in median household income, while median household income increased in 234 counties (7.4 percent).
· Among the more than 29,000 places in the United States, 3,254 places (11.1 percent) experienced a decline in median household income, while 926 places (3.2 percent) experienced income growth.
· For the period of 2012 to 2016, the locations with the highest and lowest median household incomes were:
o By county and county equivalent:
· Loudon County, Va., Falls Church City, Va., Fairfax County, Va., Howard County, Md., and Arlington County, Va., were among the highest.
· McCreary County, Ky., Sumter County, Ala., Holmes County, Miss., Stewart County, Ga., and Lee County, Ky., were among the lowest.
o By metropolitan statistical area:
· San Jose-Sunnyvale-Santa Clara, Calif., Washington-Arlington-
· Brownsville-Harlingen, Texas, Sebring, Fla., McAllen-Edinburg-Mission, Texas, Pine Bluff, Ark., and Valdosta, Ga., metropolitan statistical areas were among the lowest.
o By micropolitan statistical area:
· Los Alamos, N.M., Summit Park, Utah, Williston, N.D., Juneau, Alaska, and Gillette, Wyo., micropolitan statistical areas were among the highest.
· Middlesborough, Ky., Rio Grande City, Texas, Helena-West Helena, Ark., Las Vegas, N.M., and Indianola, Miss., micropolitan statistical areas were among the lowest.
Poverty
· Of the 3,142 counties across the nation, 167 counties (5.3 percent) experienced a decline in poverty rates, while 566 counties (18.0 percent) showed a rate increase.
· Looking at the more than 29,000 places in the United States, 1,391 places (4.7 percent) experienced a decline in poverty rates, while 2,927 places (10.0 percent) had their poverty rates increase.
· From 2012 to 2016, among geographic areas with 10,000 people or more:
o By county and county equivalent:
· Falls Church City, Va., and Lincoln County, S.D., had among the lowest poverty rates for counties and county equivalents.
· Oglala Lakota County and Todd County in South Dakota, Holmes County, Miss., and McCreary County, Ky., had among the highest poverty rates.
o By metropolitan statistical area:
· Among all metropolitan areas, Fairbanks, Alaska, California-Lexington Park, Md., Midland, Texas, and Barnstable Town, Mass., had among the lowest poverty rates.
· Brownsville-Harlingen, McAllen-Edinburg-Mission and Laredo, Texas, had among the highest poverty rates.
o By micropolitan areas:
· Los Alamos, N.M., McPherson, Kan., and Dickinson, N.D., were among those with lower poverty rates.
· aGallup, N.M., Cleveland, Miss., and Rio Grande City and Raymondville, Texas, were among those with higher poverty rates.
Also Released from the American Community Survey:
· The five-year estimates feature “Comparison Profile” tables. These tables compare differences between the latest set of American Community Survey five-year estimates (2012-2016) and the most recent, nonoverlapping five-year estimates (2007-2011). The tables note statistically significant differences.
· The Application Programming Interface updated with 2012-2016 American Community Survey five-year estimates statistics.
New Data Exploration Platform with County-Level Geography Profiles
The U.S. Census Bureau is currently working to streamline online data dissemination to be more customer-driven and user-friendly by creating one centralized and standardized platform to underlie the search on census.gov. In addition to being available through the American FactFinder, some of the 2012-2016 American Community Survey five-year estimates will be released through the new platform, which is currently a preview site at data.census.gov. Specific products available include detailed tables, data profiles, subject tables and comparison profiles.
New for this release, data.census.gov is featuring county-level geography profiles, which provide data users a high-level overview of each of the 3,144 counties in a visual format with maps, charts and graphs. These profiles include 2012-2016 American Community Survey five-year estimates data on a variety of topics including income, commuting, home ownership and veterans, as well as business and industry data from the 2012 Economic Census, 2012 County Business Patterns and 2015 Survey of Business Owners.
We encourage you to take a look at data.census.gov and provide your thoughts on our work in progress at cedsci.feedback@census.gov.
About the American Community Survey
The American Community Survey is the only source of small area statistics for social, economic, housing and demographic characteristics. It gives communities the current information they need to plan investments and services. Retailers, homebuilders, police departments, and town and city planners are among the many private- and public-sector decision-makers who count on these annual results. Visit the Stats in Action Videos page to see examples. These statistics would not be possible without the participation of the randomly selected households in the survey.
Because it is a survey based on a sample of the population rather than the entire population, the American Community Survey produces estimates. To aid data users, the Census Bureau calculates and publishes a margin of error for every estimate. For guidance on making comparisons, please visit census.gov.
Citation Guidance
When sourcing this data, please use “2012-2016 American Community Survey 5-year estimates.”
|
Subscribe to:
Posts (Atom)