|
Friday, April 29, 2016
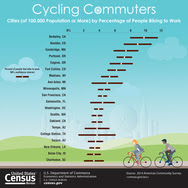
Bike to Work Week, May 16-20
Thursday, April 28, 2016
How the Other Fifth Lives
From the New York Times:
For years now, people have been talking about the insulated world of the top 1 percent of Americans, but the top 20 percent of the income distribution is also steadily separating itself — by geography and by education as well as by income.
This self-segregation of a privileged fifth of the population is changing the American social order and the American political system, creating a self-perpetuating class at the top, which is ever more difficult to break into.
In hard numbers, the percentage of families with children living in very affluent neighborhoods more than doubled between 1970 and 2012, from 6.6 percent to 15.7 percent.
At the same time, the percentage of families with children living in traditional middle class neighborhoods with median incomes between 80 and 125 percent of the surrounding metropolitan area fell from 64.7 percent in 1970 to 40.5 percent.
Wednesday, April 27, 2016
Federal Court Finds Amazon Liable for Billing Parents for Children’s Unauthorized In-App Charges
Court Will Decide Amount of Monetary Relief Amazon Owes in Coming Months
A federal judge has granted the Federal Trade Commission’s request for summary judgment in the agency’s lawsuit against Amazon, Inc., for billing consumers for unauthorized in-app charges incurred by children.
The judge’s order in the case finds that Amazon received many complaints from consumers about surprise in-app charges incurred by children, citing the fact that the company’s disclosures about the possibility of in-app charges within otherwise “free” apps were not sufficient to inform consumers about the charges.
“We are pleased the federal judge found Amazon liable for unfairly billing consumers for unauthorized in-app purchases by children,” said FTC Chairwoman Edith Ramirez. “We look forward to making a case for full refunds to consumers as a result of Amazon’s actions.”
The order calls for further representations from the FTC and Amazon regarding the precise amount of monetary relief Amazon owes consumers as a result of its unlawful practices. In addition, the order grants a partial summary judgment requested by Amazon regarding injunctive relief requested by the FTC in the case.
The FTC’s case against Amazon was first filed in July, 2014. The FTC reached settlements with Apple, Inc. and Google, Inc. related to unauthorized in-app charges incurred by children requiring the companies to fully refund consumers for such charges, resulting in refunds to consumers totaling over $50 million.
Tuesday, April 26, 2016
Characteristics of minimum wage workers, 2015
From the Bureau of Labor Statistics:
In 2015, 78.2 million workers age 16 and older in the United States were paid at hourly rates, representing 58.5 percent of all wage and salary workers. Among those paid by the hour, 870,000 workers earned exactly the prevailing federal minimum wage of $7.25 per hour. About 1.7 million had wages below the federal minimum. Together, these 2.6 million workers with wages at or below the federal minimum made up 3.3 percent of all hourly paid workers.
The percentage of hourly paid workers earning the prevailing federal minimum wage or less declined from 3.9 percent in 2014 to 3.3 percent in 2015. This remains well below the percentage of 13.4 recorded in 1979, when data for hourly-paid were first collected on a regular basis.
This report presents highlights and statistical tables describing workers who earned at or below the federal minimum wage in 2015. The data are obtained from the Current Population Survey (CPS), a national monthly survey of approximately 60,000 households conducted by the U.S. Census Bureau for the U.S. Bureau of Labor Statistics (BLS). Information on earnings is collected from one-fourth of the CPS sample each month.
The CPS does not include questions on whether workers are covered by the minimum wage provisions of the federal Fair Labor Standards Act (FLSA) or by individual state or local minimum wage laws. The estimates of workers paid at or below the federal minimum wage are based solely on the hourly wage they report, which does not include overtime pay, tips, or commissions.
Monday, April 25, 2016
Older Americans Month: May 2016
President Kennedy first celebrated older Americans by designating May 1963 as Senior Citizens Month. After a meeting with the National Council of Senior Citizens, Kennedy encouraged all Americans to pay tribute to older people across the country. Every President since has issued a formal proclamation during or before the month of May in support of older Americans. In 1980, President Jimmy Carter’s proclamation changed the name to Older Americans Month. This month continues to be a time to celebrate those 65 and older through ceremonies, events and public recognition.
46.2 million
The number of people who were 65 and older in the United States on July 1, 2014. This group accounted for 14.5 percent of the total population. The 65 and older population grew from 44.7 million in 2013. Source: 2014 Population Estimates <http://factfinder.census.gov/
98.2 million
Projected population of people 65 and older in 2060. People in this age group would comprise nearly one in four U.S. residents at that time. Of this number, 19.7 million would be 85 or older. Source: 2014 National Population Projections, Table 3 <http://www.census.gov/
2.4 million
Projected number of baby boomers in 2060. At that time, the youngest baby boomers would be 96 years old. Source: Population Estimates and Projections <http://www.census.gov/prod/
2033
The year in which, for the first time, the population 65 and older would outnumber people younger than 18 in the U.S. Source: 2014 National Population Projections <http://www.census.gov/
Thursday, April 21, 2016
US ranks 41 out of 180 in global press freedom
From BoingBoing:
Uruguay, Namibia, Samoa, Ghana, and South Africa all offer a greater "level of freedom of information” than the United States, according to Reporters Without Borders' 2016 World Press Freedom Index. The U.S. is ranked at 41 out of 180 countries in the survey.
RSF says the U.S. moved from 49th place in 2015 up to 41 this year, but "relative improvement by comparison hides overall negative trends." In other words, we're still screwed on press freedom, and the future doesn't look great.
From NPR's Laura Wagner, on The Two-Way:
Citing the U.S. government's "war on whistleblowers who leak information about its surveillance activities, spying and foreign operations, especially those linked to counter-terrorism," and the country's lack of a "shield law" that would allow journalists to protect confidential sources, the report takes a decidedly negative view of U.S. press freedom.
Monday, April 18, 2016
How is New York City growing if it’s constantly losing people?
From Stat Chat @the University of Virginia
Year after year, some of the nation’s most dynamic cities are also the nation’s biggest losers when it comes to migrants. Yet rather than waste away, they continue to boom. This widely misunderstood paradox leads to some interesting articles every time the Census Bureau releases a new round of county population and migration estimates, as it did several weeks ago.
New York City is the prime example, as it is for most urban phenomena in the U.S. Four of New York’s five boroughs – all but Staten Island – were among the eight counties with the biggest losses in net domestic migration last year...
The conclusion suggested by domestic migration numbers is that New York is dying as its residents abandon ship, dragging down statewide migration numbers with it. New Yorkers would be right to question such pronouncements in the face of their skyrocketing rents, though. The city is as crowded and economically powerful as ever. Its population continues to climb despite an astronomical cost of living that suggests even more people would live there if they could. From 2010 to 2015, the Census Bureau estimates that New York City’s population increased by over 375,000. This is despite the fact that it had a net loss of over 400,000 migrants to other parts of the country.
Friday, April 15, 2016
Gambling Not a Solution to State Revenue Woes
From the Rockefeller Institute:
States turning to gambling as a possible quick fix for revenue woes have often been disappointed with the results, according to a just released study from the Nelson A. Rockefeller Institute of Government, entitled State Revenues From Gambling: Short-Term Relief, Long-Term Disappointment [PDF link].
According to Lucy Dadayan, senior policy analyst at the Institute and principal author of the report, despite the steep declines in tax revenues during the "Great Recession" most states were reluctant to raise taxes on income or sales. As an alternative, she reports, officials in many states turned to taxes on gambling, part of what are often called "sin taxes." In the recession's wake, over a dozen of states have legalized and expanded different forms of gambling activities in the hopes of raising more revenues, despite the fact gambling revenue plays a small role in state budgets, ranging between 2.0 and 2.5 percent of state own-source general revenues in the typical state.
The report demonstrates that tax and fee revenues from gambling activities have softened considerably in recent years, due, in part, to market saturation and industry cannibalization.
Thursday, April 14, 2016
Most Large Profitable U.S. Corporations Paid Tax but Effective Tax Rates Differed Significantly from the Statutory Rate
What GAO Found
In each year from 2006 to 2012, at least two-thirds of all active corporations had no federal income tax liability. Larger corporations were more likely to owe tax. Among large corporations (generally those with at least $10 million in assets) less than half—42.3 percent—paid no federal income tax in 2012. Of those large corporations whose financial statements reported a profit, 19.5 percent paid no federal income tax that year. Reasons why even profitable corporations may have paid no federal tax in a given year include the use of tax deductions for losses carried forward from prior years and tax incentives, such as depreciation allowances that are more generous in the federal tax code than those allowed for financial accounting purposes. Corporations that did have a federal corporate income tax liability for tax year 2012 owed $267.5 billion.
Percentage of Corporations That Reported No Tax Liability after Tax Credits, Tax Years 2006 to 2012

These reasons also explain why corporate effective tax rates (ETR) can differ substantially from statutory tax rates. ETRs attempt to measure taxes paid as a proportion of economic income, while statutory rates indicate the amount of tax liability (before any credits) relative to taxable income, which is defined by tax law and reflects tax benefits built into the law. The statutory tax rate on net corporate income ranges from 15 to 35 percent, depending on the amount of income earned. For tax years 2008 to 2012, profitable large U.S. corporations paid, on average, U.S. federal income taxes amounting to about 14 percent of the pretax net income that they reported in their financial statements (for those entities included in their tax returns).
Tuesday, April 12, 2016
Demographic and Economic Profiles of New York’s Electorate
In advance of the New York primary on April 19, the U.S. Census Bureau presents a variety of statistics that give an overall profile of the state’s voting-age population and industries. Statistics include:
· Breakdown of voting-age population by race and Hispanic origin (Hispanic origin and race alone) (race alone or in combination).
· Selected economic characteristics, including median household income and poverty.
· Selected social characteristics, including educational attainment.
· County Business Patterns (providing information on employment by specific industries).
· Statistics on voting and registration.
Friday, April 8, 2016
UN Data -recent updates
Visit UN Data metadata
The Human Development Report is a reliable source and an alternative perspective on critical issues for human development worldwide. Featuring the Human Development Index, every report presents agenda-setting data and analysis and calls international attention to issues and policy options that put people at the center of strategies to meet the challenges of development today - economic, social, political, and cultural.
Last update in UNdata: 22 Mar 2016
The Economic Statistics Branch of the United Nations Statistics Division (UNSD) maintains and annually updates the National Accounts Main Aggregates database. It consists of a complete and consistent set of time series, from 1970 onwards, of the main National Accounts aggregates of all UN Members States and other territories in the world for which National Accounts information is available. Its contents are based on the official data reported to UNSD through the annual National Accounts Questionnaire, supplemented with data estimates for any years and countries with incomplete or inconsistent information.
Last update in UNdata: 16 Mar 2016
The UNESCO Institute for Statistics (UIS) provides UNdata with a subset of the more than 1,000 indicators which may be found in the UIS Data Centre.
The UIS Data Centre contains indicators and raw data on education, literacy, science, culture and communication. The UIS collects these data from more than 200 countries and international organizations.
Last update in UNdata: 24 Feb 2016
The Millennium Development Goals Database presents official data for more than 60 indicators to measure progress towards the Millennium Development Goals. The data and analyses are the product of the work of the Inter-agency and Expert Group (IAEG), coordinated by the United Nations Statistics Division.
Last update in UNdata: 24 Feb 2016
The Greenhouse Gas (GHG) Inventory Data
Thursday, April 7, 2016
Data USA
From Data USA, re its origins in 2014:

The site was referenced in the New York Times in April 2016.

A team comprised of economists, data scientists, designers, researchers and business executives, worked for over a year with input from policymakers, government officials and everyday citizens to develop Data USA, the most comprehensive website and visualization engine of public US Government data. Data USA tells millions of stories about America. Through advanced data analytics and visualization, it tells stories about: places in America—towns, cities and states; occupations, from teachers to welders to web developers; industries--where they are thriving, where they are declining and their interconnectedness to each other; and education and skills, from where is the best place to live if you’re a computer science major to the key skills needed to be an accountant.
Data USA puts public US Government data in your hands. Instead of searching through multiple data sources that are often incomplete and difficult to access, you can simply point to Data USA to answer your questions. Data USA provides an open, easy-to-use platform that turns data into knowledge. It allows millions of people to conduct their own analyses and create their own stories about America – its people, places, industries, skill sets and educational institutions. Ultimately, accelerating society’s ability to learn and better understand itself.
The site was referenced in the New York Times in April 2016.
Monday, April 4, 2016

Subscribe to:
Posts (Atom)