The health care and social assistance industry is projected to increase its share of total wage and salary employment to 14.5 percent by 2024, up from 12.8 percent in 2014 and 10.8 percent in 2004. The share of employment represented by professional and business services is also projected to increase, rising from 12.3 percent in 2004 and 13.5 percent in 2014 to 13.9 percent in 2024.
The share of total wage and salary employment represented by manufacturing is projected to decline in the coming period, falling from 10.7 percent in 2004 and 8.6 percent in 2014 to 7.6 percent in 2024. The decline in manufacturing’s employment share is the largest of any industry sector for the 2014–24 period.
More from the the Bureau of Labor Statistics.
Thursday, December 31, 2015
Wednesday, December 30, 2015
People who are not in the labor force: why aren't they working?
People who are neither working nor looking for work are counted as “not in the labor force,” according to the U.S. Bureau of Labor Statistics. Since 2000, the percentage of people in this group has increased. Data from the Current Population Survey (CPS) and its Annual Social and Economic Supplement (ASEC) provide some insight into why people are not in the labor force. The ASEC is conducted in the months of February through April and includes questions about work and other activities in the previous calendar year.
For example, data collected in 2015 are for the 2014 calendar year, and data collected in 2005 are for the 2004 calendar year.1 In the ASEC, people who did not work at all in the previous year are asked to give the main reason they did not work. Interviewers categorize survey participants’ verbatim responses into the following categories: ill health or disabled; retired;2 home responsibilities; going to school; could not find work;3 and other reasons.
This Beyond the Numbers article examines data on those who were not in the labor force during 2004 and 2014 and the reasons they gave for not working.
More from the Bureau of Labor Statistics.
Tuesday, December 29, 2015
Annualized Population Growth 2010-15 map, US by state

The annualized estimates of pop growth for the period 2010-15. Thanks to Joe Francis at Cornell.
Monday, December 28, 2015
The Effects of Lawn Signs on Vote Outcomes
Lawn signs are one of the few campaign tactics deployed by candidates for every level of government in the United States. Inexpensive and relatively easy to deploy, lawn signs are a tactic available to even the most obscure and underfunded candidate for a down-ballot office. Indeed, the efflorescence of roadside lawn signs is often one of the few outward manifestations of a low-salience election.
Although campaign tactics ranging from door-to-door canvassing to robotic phone calls have been evaluated by a vast array of field experiments conducted during the past fifteen years, lawn signs have largely escaped scholarly attention.
Working in collaboration with a congressional candidate, a mayoral candidate, an independent expenditure campaign directed against a gubernatorial candidate, and a candidate for county commissioner, we tested the effects of lawn signs by planting them in randomly selected voting precincts.
More from Science Direct
Thursday, December 24, 2015
Women in the labor force: a databook
Over the past 70 years, women’s participation in labor force activities has greatly expanded. Immediately following World War II, less than one-third of women were in the labor force. However, women soon began to participate in greater numbers, and their labor force participation rose rapidly from the 1960s through the 1980s before slowing in the 1990s.
Women reached the peak of their labor force participation in 1999, with a rate of 60.0 percent. Since then, labor force participation among women has declined, to 57.0 percent in 2014, which is still relatively high by historical standards.
More from the Bureau of Labor Statistics
Women reached the peak of their labor force participation in 1999, with a rate of 60.0 percent. Since then, labor force participation among women has declined, to 57.0 percent in 2014, which is still relatively high by historical standards.
More from the Bureau of Labor Statistics
Wednesday, December 23, 2015
Sesame Street for Military Families: A New Site
Young children are not immune to the stresses of military family life. If you have a preschooler, you know that relocations and deployments can be hard on the little ones.
The new Sesame Street for Military Families site can help youngsters through these times. With videos and activities for the kids and tips for the parents, the site and mobile apps take on the challenges—including injury and even death of a parent—with the special comfort that Elmo and Friends provide.
Tuesday, December 22, 2015
North Carolina Becomes 9th State With 10 Million or More People
By adding an average of 281 people per day during the last year, North Carolina’s population crossed the 10 million mark, making the state the ninth in that category, according to U.S. Census Bureau state population estimates released today.
North Carolina’s population gain over the July 1, 2014, to July 1, 2015, period ranked it behind only Texas, Florida, California, Georgia and Washington.
Notably, Florida added more people than California for the first time in nearly a decade. Florida’s gain of 365,703 people also pushed it past 20 million, becoming the third state to reach that milestone. California continued to be the most populous state on July 1, 2015, with 39.1 million, followed by Texas with 27.5 million.
North Dakota was the nation’s fastest-growing state or equivalent over the last year, for the fourth year in a row. Its population increased 2.3 percent, followed by 1.9 percent growth in Colorado, the District of Columbia and Nevada. Each of the 10 fastest-growing states was in the South or West with the exception of North Dakota.
Seven states lost population between July 1, 2014, and July 1, 2015: Illinois
Monday, December 21, 2015
“Whatever” Most Annoying Word for Seventh Year
For the seventh consecutive year, “whatever” tops the list as the word or phrase Americans, 43%, consider to be the most annoying. “No offense, but” is a distant second with 22% followed closely by “like” with 20%. Seven percent are irked by “no worries” while 3% consider “huge” to be most irritating.
In last year’s survey, the same proportion, 43%, called “whatever” the most annoying word followed by “like” with 23%. “Literally” received 13% while 10% mentioned “awesome.” Eight percent chose “with all due respect” as the most irritating word or phrase in 2014.
Regardless of age, race, gender, region of residence, income, or level of education, “whatever” is thought to be the most bothersome word in casual conversation today. Of note, Americans in the South, 48%, and Midwest, 46%, are more likely than those in the Northeast, 38%, and in the West, 36%, to dislike the word, “whatever.” African Americans, 54%, are more likely to be annoyed by “whatever, than whites, 41%, or Latinos, 42%.
More from Marist poll. per here.
Saturday, December 19, 2015
Follow Santa's Journey!
Are your kids talking non-stop about the big day? Why not turn up the anticipation just a notch with our Tracking Santa on Christmas page?
We have a Santa Tracking trailer and we link to the official NORAD Santa Tracker website where your kids can view the countdown, listen to some holiday tunes, play games, and so much more!
And remember on December 24th, make sure the kids visit the NORAD site to track Santa as he flies around the world delivering gifts!
Friday, December 18, 2015
Census Bureau Releases 2014 Annual Survey of Manufactures Data
The U.S. Census Bureau today released statistics from three 2014 Annual Survey of Manufactures files: General Statistics for Industry Groups and Industries, Value of Products Shipments and Geographic Area Statistics.
The files show that the U.S. manufacturing sector’s $5.9 trillion in shipments in 2014 were up 1.2 percent, from $5.8 trillion in 2013. Shipments for Kansas climbed 7.1 percent, from $89.2 billion in 2013 to $95.5 billion in 2014.
State highlights include:
· Among states and equivalents, manufacturing shipments in 2014 ranged from $0.3 billion in the District of Columbia to $698.7 billion in Texas.
Thursday, December 17, 2015
Infographic: A Look at the Mining Sector in the US
A collection of three visualizations presenting data from the 2012 Economic Census Geographic Area Series on the leading mining states.
The graphs illustrate the states with more than 10,000 mining sector employees, show how mining jobs in these states are distributed by subsector, and compare the value of mining shipments in them before and after the last recession. Among the mining subsectors are oil and gas extraction and support activities.
Internet address: <http://www.census.gov/
Tuesday, December 15, 2015
Los Angeles County a Microcosm of Nation’s Diverse Collection of Business Owners
Los Angeles County, Calif., led the nation in the number of Hispanic-, Asian-, and American Indian and Alaska Native-owned firms in 2012, according to estimates released this week by the U.S. Census Bureau. It also ranked second in the number of black or African American- and Native Hawaiian and Other Pacific Islander-owned firms (after Cook County, Ill., and Honolulu County, Hawaii, respectively).
Collectively, Los Angeles County was home to 631,218 minority-owned firms: 332,967 Hispanic, 213,203 Asian, 81,563 black or African American, 11,081 American Indian and Alaska Native, and 3,798 Native Hawaiian and Other Pacific Islander. Consequently, with 3.2 percent of the nation’s total population (according to the Census Bureau’s July 1, 2012, population estimates), the county was home to 7.9 percent of its minority-owned businesses in 2012.
The majority of firms in Los Angeles County (55.0 percent) were minority-owned. This includes 29.0 percent Hispanic-owned, 18.6 percent Asian-owned, 7.1 percent black or African American-owned, 1.0 percent owned by American Indians and Alaska Natives, and 0.3 percent Native Hawaiian and Other Pacific Islander-owned.
These findings for Los Angeles County are an example of the local analysis possible using the final, revised statistics from the 2012 Survey of Business Owners released today.
Nationally, today’s findings show the number of minority-owned firms in the U.S. rose from 5.8 million in 2007 to 8.0 million in 2012. This includes a 46.3 percent increase in the number of Hispanic-owned firms over the period, from 2.3 million to 3.3 million, and a 34.5 percent rise in the number of black or African American-owned firms, from 1.9 million to 2.6 million. Additionally, the number of Asian-owned firms climbed from 1.5 million to 1.9 million, an increase of 23.8 percent. For added context, total U.S. firms increased 2.0 percent during the same period, from 27.1 million in 2007 to 27.6 million in 2012.
The 9.9 million women-owned firms in 2012 were up more than 2 million from five years earlier when there were 7.8 million women-owned businesses, a 26.8 percent increase. As a comparison, male-owned firms increased 6.8 percent from 13.9 million to 14.8 million during the same period.
Postal Employee Tipping and Gift-Receiving Policy
From here:
All postal employees, including carriers, must comply with the Standards of Ethical Conduct for Employees of the Executive Branch. Under these federal regulations, carriers are permitted to accept a gift worth $20 or less from a customer per occasion, such as Christmas.
However, cash and cash equivalents, such as checks or gift cards that can be exchanged for cash, must never be accepted in any amount. Furthermore, no employee may accept more than $50 worth of gifts from any one customer in any one calendar year period.
Monday, December 14, 2015
The U.S. economy to 2024
The U.S. economy continues to heal in the aftermath of the Great Recession. Steadily recovering consumption, investment, and housing assist an improving economy, whereas structural factors, such as an aging population, limit the prospects for more rapid growth over the coming decade. The Bureau of Labor Statistics (BLS) projects that growth will continue, but at a slower rate than that seen before the onset of the 2007–09 recession.
The United States is now more than 6 years into a recovery characterized by slow growth in gross domestic product (GDP), a declining labor force participation rate, low inflation, and disappointing productivity gains. From 2010 to 2014, GDP growth averaged just 2.1 percent annually, a much slower rate than the 3.0-percent or higher annual growth experienced in recent decades.
More from Bureau of Labor Statistics.
Saturday, December 12, 2015
Reasons for unemployment in November 2015
In November 2015, about 3.9 million people were unemployed because they had lost their jobs involuntarily or had completed temporary jobs. There were 586,000 fewer unemployed job losers in November than a year earlier. There were 2,444,000 unemployed reentrants to the labor force in November 2015, about 317,000 fewer than a year earlier. Reentrants are people who previously worked but were out of the labor force before they began their job search.
There were 843,000 unemployed new entrants to the labor force in November 2015, down 202,000 from a year earlier. These are people who had never worked before they began their job search. There were 800,000 unemployed job leavers in November 2015, about the same as a year earlier. These are people who quit or voluntarily ended their jobs and began searching for a new job.
Bureau of Statistics
Friday, December 11, 2015
Consumer prices for alcoholic beverages since 2003
Whether you're celebrating the holidays at home or out on the town, you may be on tap to treat yourself or your friends to a beer or some other alcoholic beverage. From January 2003 to October 2015, the Consumer Price Index for alcoholic beverages increased 30 percent. Over that period, consumer prices for alcoholic beverages purchased for consumption away from home increased 46 percent, compared with 20 percent for those purchased for consumption at home. Prices for nonalcoholic beverages and beverage materials increased 20 percent.
Learn more at:BLSupdate
Learn more at:BLSupdate
Thursday, December 10, 2015
2014 Income and Poverty Estimates for All Counties released by Census Bureau
This week, the Census Bureau released the latest findings from its Small Area Income and Poverty Estimates program. The program provides the only up-to-date, single-year income and poverty statistics for all counties and school districts — roughly 3,140 counties and nearly 14,000 school districts nationally.
Tables provide statistics on the number of people in poverty, the number of children younger than age 5 in poverty (for states only), the number of children ages 5 to 17 in families in poverty, the number younger than age 18 in poverty, and median household income. At the school district level, estimates are available for the total population, the number of children ages 5 to 17 and the number of children ages 5 to 17 in families in poverty.
Wednesday, December 9, 2015
Type of injury or illness and body parts affected by nonfatal injuries and illnesses in 2014
Sprains, strains, or tears were the leading injury or illness in private industry and state and local government in 2014. There were 420,870 of these cases requiring days away from work to recuperate. The incidence rate was 38.9 cases per 10,000 full-time workers, down from 40.2 in 2013. Workers who suffered sprains, strains, or tears needed a median of 10 days away from work, compared to 9 days for all types of injuries or illnesses.
Learn more at:Bplans
Learn more at:Bplans
Tuesday, December 8, 2015
The Threat to Representation for Children and Non-Citizens: the Potential Impact of Evenwel v. Abbott on Redistricting
The Supreme Court agreed to hear a case that could alter the way virtually all legislative districts in the United States are drawn. Set for hearing on December 8, 2015, the case of Evenwel vs. Abbott questions the use of the population equality standard to draw state legislative districts in Texas. The plaintiffs argued for the use of registered voters or potential voters (defined as voting age citizens) instead of the total population in a given district.
On November 5, 2014, the three judge court upheld the population equality standard for use in Texas, but the Supreme Court set the case for argument instead of simply affirming the appellate court opinion. This means that they plan to review the use of the population equality standard to draw districts, and could rule that the appropriate standard counts voters or potential voters instead of total
population. Presented here is an analysis of the impact the case could have on how districts are drawn and constituents are represented.
The population equality standard has been used by most jurisdictions since at least the 1970 redistricting round, so shifting to a standard of voters or potential voters would be a radical change. It would force substantial shifts in many redistricting plans because while the case concerns state legislatures, it could impact how districts from congressional down to city and county are drawn. The change would also have the effect of diminishing the representation of children (those under 18) and non-citizens.
This report assesses the impact of using an eligible voter equality standard on the current congressional and state legislative districts using the same materials that would have been available at the time redistricting was done.
Go to Social Explorer.
Monday, December 7, 2015
Women's earnings compared to men's earnings in 2014
In 2014, women who were full-time wage and salary workers had median usual weekly earnings of $719. Women’s median earnings were 83 percent of those of male full-time wage and salary workers ($871).
,br> Median weekly earnings for women were highest between the ages of 35 and 64. In 2014, there was little or no difference in the earnings of 35- to 44-year-olds ($781), 45- to 54-year-olds ($780), and 55- to 64-year-olds ($780).
For men, earnings peaked between the ages of 45 and 64, with 45- to 54-year-olds ($1,011) and 55- to 64-year-olds ($1,021) having similar earnings. Young women and men ages 16 to 24 had the lowest earnings ($451 and $493, respectively).
Read more at: BLSupdate
Wednesday, December 2, 2015
The Growth of "American" as an Ancestral Choice in the ACS
It is interesting to see how the Herkimer/Oneida County response to the question of ancestry has changed over time when looking at those that identified as having a single ancestry - "American". While the area used to be similar to the rest of the state and country, in the last five years it has seen a huge rise regionally in the percent of people who now say that they are simply "American" when asked about their ancestral past.
More from Herkimer and Oneida Counties Census Data Affiliate.
Here are counties with single year ACS data…ordered by % saying AMERICAN…
Madison County, New York 42,638 20,671 48.5%
Chemung County, New York 49,475 16,284 32.9%
Oneida County, New York 134,037 36,384 27.1%
Niagara County, New York 120,241 30,586 25.4%
Steuben County, New York 47,596 11,394 23.9%
Orange County, New York 226,108 48,854 21.6%
Tompkins County, New York 52,753 11,053 21.0%
Oswego County, New York 49,703 9,984 20.1%
Warren County, New York 28,849 4,475 15.5%
Ontario County, New York 50,787 6,216 12.2%
Cattaraugus County, New York 35,854 4,255 11.9%
St. Lawrence County, New York 52,168 5,754 11.0%
Sullivan County, New York 37,400 3,943 10.5%
Broome County, New York 83,176 7,833 9.4%
Albany County, New York 158,430 14,408 9.1%
Chautauqua County, New York 57,055 5,179 9.1%
Saratoga County, New York 93,120 8,007 8.6%
Schenectady County, New York 83,278 7,073 8.5%
Jefferson County, New York 52,942 4,481 8.5%
Cayuga County, New York 34,603 2,674 7.7%
Dutchess County, New York 142,205 9,916 7.0%
Onondaga County, New York 225,269 15,547 6.9%
Rensselaer County, New York 61,427 3,882 6.3%
Rockland County, New York 212,269 13,032 6.1%
Monroe County, New York 406,058 24,249 6.0%
Nassau County, New York 836,135 47,256 5.7%
Suffolk County, New York 850,838 47,395 5.6%
New York County, New York 1,070,770 53,578 5.0%
Kings County, New York 1,955,952 95,355 4.9%
Ulster County, New York 84,629 4,114 4.9%
Westchester County, New York 652,524 31,059 4.8%
Erie County, New York 484,137 19,753 4.1%
Queens County, New York 1,774,242 69,328 3.9%
Richmond County, New York 310,984 9,617 3.1%
Bronx County, New York 1,191,498 19,991 1.7%
Tuesday, December 1, 2015
Learn To Manage Emotional Distress
Television or Internet coverage of upsetting events like natural disasters, terrorist attacks, or mass shootings can affect our sense of order and safety. It may even impact those with no personal connection to the situation.
If you have kids, learning how to put the news in proper context and addressing their concerns can help them understand the situation and reduce distress.
Find out who is most at risk of emotional distress from incidents of mass violence and where to find help. If you are in emotional distress caused by recent events or know someone who is, seek help by calling the Disaster Distress Hotline at 1-800-985-5990 or text TalkWithUs to 66746.
Monday, November 30, 2015
Travel Alerts and Warnings - What's the Difference?
The U.S. State Department is issuing travel warnings and travel alerts as concerns about U.S. citizens traveling abroad has increased. Review the guidance on what is a warning versus an alert as you make plans for traveling outside of the United States.
Learn about the benefits of enrolling in the Smart Traveller Enrollment Program (STEP), including helping loved ones get in contact with you in the case of an emergency.
|
Friday, November 27, 2015
The Economic Imperative of Bilingual Education (1965)
In a break with tradition, more schools are adopting language-immersion programs, in which English and another language are integrated into the curriculum and instruction. The Center for Applied Linguistics, a D.C.-based nonprofit, found an exponential growth in foreign-language immersion in a comprehensive survey of public schools and some private schools. Over a 40-year span language-immersion schools grew steadily, with the largest increase in the decade that started in 2001. Spanish remains the most popular for immersion programs at 45 percent, followed by French (22 percent) and Mandarin (13 percent), with a wide array of languages rounding out the list of 22 selections—from Hawaiian and Cantonese to Japanese and Arabic.
As two-way immersion grows, the variety of language options now available marks a turning point in the evolution of bilingual education. Once the mainstay of immigrant children, bilingual instruction has a new band of converts: English-speaking parents, lawmakers, and advocacy groups. Research shows that students gain cognitive and academic benefits from bilingualism. Yet an overarching reason for the heightened interest is giving U.S. students a jump on the competition in a global workforce. And some activists find even with this flurry of attention, equal access to dual-immersion remains a thorny issue and persistent challenge.
More from The Atlantic.
Thursday, November 26, 2015
Thanksgiving Day: Nov. 26, 2015
In the fall of 1621, the Pilgrims — early settlers of Plymouth Colony — held a three-day feast to celebrate a bountiful harvest. This event is regarded by many as the nation’s first Thanksgiving. The Wampanoag Indians in attendance played a key role. Historians have recorded ceremonies of thanks among other groups of European settlers in North America. These include the British colonists in Virginia as early as 1619.
The legacy of thanks and the feast have survived the centuries, as the event became a national holiday 152 years ago (Oct. 3, 1863) when President Abraham Lincoln proclaimed the last Thursday of November as a national day of thanksgiving. Later, President Franklin Roosevelt clarified that Thanksgiving should always be celebrated on the fourth Thursday of the month to encourage earlier holiday shopping, never on the occasional fifth Thursday.
Where to Feast
117 million
Number of occupied housing units across the nation in the second quarter of 2015 — all potential stops for Thanksgiving dinner. Source: U.S. Census Bureau, Housing Vacancies and Homeownership, Table 8 <http://www.census.gov/
Wednesday, November 25, 2015


Is Your Passport Full? Request Extra Pages Now
The U.S. State Department is Eliminating Page Inserts
If you like to travel and you're running out of passport pages for visas, the time to request extra pages is now. Starting January 1st, 2016, the U.S. State Department will no longer add additional pages to U.S. passports. You will need to renew your passport altogether after this date if you need more space.
Learn about adding pages to passports, processing times and more.
Tuesday, November 24, 2015
Completion of 2012 Economic Census Geographic Area Series: Professional, Scientific and Technical Services
The 2012 Economic Census concludes the Geographic Area Series for the professional, scientific and technical services sector. This series includes statistics for legal services, accounting and tax preparation, computer systems design, and advertising and public relations services.
The files provide statistics on the number of establishments, receipts/revenue, payroll, number of employees and other data items by industry. Geographic Area Series data is the only series that provides this data at a U.S. summary level as well as an economic place level; other geographies included are states, combined statistical areas, metropolitan statistical areas and counties.
The files provide statistics on the number of establishments, receipts/revenue, payroll, number of employees and other data items by industry. Geographic Area Series data is the only series that provides this data at a U.S. summary level as well as an economic place level; other geographies included are states, combined statistical areas, metropolitan statistical areas and counties.
Monday, November 23, 2015
Wives’ Earnings Make Gains Relative to Husbands’
|

Thursday, November 19, 2015
The US used to accept a lot of refugees
The United States has pledged to take 10,000 Syrian refugees in fiscal year 2016 — five times the number the country has resettled since 2011, when the Syrian civil war began.
So needless to say, there are questions of whether the US will actually be able to resettle 10,000 Syrian refugees this fiscal year.
But to get a sense of how many refugees this actually is, it's helpful to look at how many refugees the US admitted in the past. And when you do that, you start to see that in historical context, 10,000 Syrian refugees isn't a very big influx at all.
The Refugee Processing Center at the State Department publishes information on how many refugees have arrived in the US.
More from Vox.
Wednesday, November 18, 2015
Global Support for Principle of Free Expression, but Opposition to Some Forms of Speech
Although many observers have documented a global decline in democratic rights in recent years, people around the world nonetheless embrace fundamental democratic values, including free expression. A new Pew Research Center survey finds that majorities in nearly all 38 nations polled say it is at least somewhat important to live in a country with free speech, a free press and freedom on the internet. And across the 38 countries, global medians of 50% or more consider these freedoms very important.
Still, ideas about free expression vary widely across regions and nations. The United States stands out for its especially strong opposition to government censorship, as do countries in Latin America and Europe – particularly Argentina, Germany, Spain and Chile. Majorities in Asia, Africa and the Middle East also tend to oppose censorship, albeit with much less intensity. Indonesians, Palestinians, Burkinabe and Vietnamese are among the least likely to say free expression is very important.
More from Pew Research Center.
Monday, November 16, 2015
25 of America's worst charities
In 2014, Americans donated an estimated $350 billion to charities. A generous country we are, but how much of those funds actually went to the advertised causes? You might not want to know. There are good charities. There are bad charities. And there are the worst charities.
America’s Worst Charities gain their titles by how much they raise in donations and how little of that money goes to the actual causes they advertise. As these deceptive organizations ask you for your financial support, they lie about to where or whom that is alloted, sometimes paying themselves “multiple salaries” and “consulting fees.” One “cancer charity” paid the company president's son nearly $18 million over eight years, to solicit donations. The Tampa Bay Times reports:
Some nonprofits are little more than fronts for fundraising companies, which bankroll their startup costs, lock them into exclusive contracts at exorbitant rates and even drive the charities into debt.
More from Daily Kos
A list, plus other resources from the Tampa Bay Times.
Friday, November 13, 2015
Veterans statistics
The Census Bureau has released a series of graphics showing maps and statistics about veterans living in the 50 states, District of Columbia and Puerto Rico.
This information is available HERE. The New York State graphic is HERE.
Please enjoy these statistics and pass them along to your networks and partners.
This information is available HERE. The New York State graphic is HERE.
Please enjoy these statistics and pass them along to your networks and partners.
Thursday, November 12, 2015
Distracted Driving Information & Guidance
Here is a resource which you may find useful - http://www.sr22insurance.net/
We believe that the best way to encourage responsible driving is through education which is why we are working with other organisations and bodies just like yours to ensure that this information reaches as many people as possible.
When asked, 94 percent of Americans said that distracted driving is a major threat to safety for everyone on the road. And, according to the National Highway Traffic Safety Administration (NHTSA), roughly 10 percent of drivers are talking on a cellphone during any given daylight moment.
According to numerous studies, distracted driving is at least as bad as, or worse than, driving while drunk. This means that, at any given moment, there are 974,000 drivers on the road who are perfectly sober but more impaired than a drunk driver.
Wednesday, November 11, 2015
Veterans Day 2015: Nov. 11
Veterans Day originated as “Armistice Day” on Nov. 11, 1919, the first anniversary marking the end of World War I. Congress passed a resolution in 1926 for an annual observance, and Nov. 11 became a national holiday beginning in 1938. President Dwight D. Eisenhower signed legislation in 1954 to change the name to Veterans Day as a way to honor those who served in all American wars. The day honors military veterans with parades and speeches across the nation. A national ceremony takes place at the Tomb of the Unknowns at Arlington National Cemetery in Arlington, Va.
Veterans
19.3 million
The number of military veterans in the United States in 2014.
Source: 2014 American Community Survey
1.6 million
The number of female veterans in the United States in 2014.
Source: 2014 American Community Survey
Tuesday, November 10, 2015
Veterans’ Stories: Share, Record, Listen and Learn

Every war veteran has a story. From the elderly World War II vet to those back from Iraq and Afghanistan, capturing these accounts for future generations is the mission of the Veterans History Project. And now you can contribute to this important part of our history's keepsake.
This Veterans Day, whether you’re ready to share your war experience or to interview a veteran who is on, you’ll find what you need in these participants’ guidelines. You can search for vets’ stories by last name, war, the branch of service, or ethnicity.
Completion of 2012 Economic Census Geographic Area Series: Finance and Insurance
The 2012 Economic Census concludes the Geographic Area Series for the finance and insurance sector. This series includes statistics for monetary authorities; credit intermediation and related activities; securities, commodity contracts and other financial investments; and insurance carriers. The files provide statistics on the number of establishments, revenue, payroll, number of employees and other data items by industry.
The Geographic Area Series provides data at a U.S. summary level as well as an economic place level; other geographies included are states, combined statistical areas, metropolitan statistical areas and counties.
The Geographic Area Series provides data at a U.S. summary level as well as an economic place level; other geographies included are states, combined statistical areas, metropolitan statistical areas and counties.
Monday, November 9, 2015
Middle-Aged White Americans Are Dying of Despair
Since 1998, people all over the world have been living healthier and living longer. But middle-aged, white non-Hispanics in the United States have been getting sicker and dying in greater numbers. The trend is being driven primarily by people with a high-school degree or less.
That's the sobering takeaway from a paper in the Proceedings of the National Academy of Sciences published this week.
The reasons for the increased death rate are not the usual things that kill Americans, like diabetes and heart disease. Rather, it’s suicide, alcohol and drug poisonings, and alcohol-related liver disease.
The least-educated are worst off.
More from The Atlantic.
What we're seeing here, I believe, is the end result of privileged distress. It's still not objectively harder to be white in American than non-white, but the traditional privileges of whiteness have shrunk, particularly for the working class, while visions of how life is supposed to be (for white people) are pegged to the achievements of our parents. Consequently, it gets harder and harder for working-class whites to live up to the expectations they were raised to have. By middle age many feel like failures, and live with a corresponding lack of self-regard.
Is it any wonder they look for scapegoats?
More from the Weekly Sift.
Thursday, November 5, 2015
Visualization: Measuring Race and Ethnicity Across the Decades: 1790-2010
This interactive visualization allows users to understand how race and ethnicity categories have changed over time since the 1790 Census. Internet address: <http://www.census.gov/
Wednesday, November 4, 2015
Copyright Infringement © - infographic
Check out this infographic on copyright infringement of images. Photos and illustrations created by other people often go without citations, or are attributed improperly. Learn how to properly give credit in a blog post.
Completion of 2012 Economic Census Geographic Area Series: Real Estate and Rental and Leasing
The 2012 Economic Census concludes the Geographic Area Series for the real estate and rental and leasing sector. This series includes statistics for real estate, rental and leasing services and lessors of nonfinancial intangible assets (except copyrighted works). The files provide statistics on the number of establishments, revenue, payroll, number of employees and other data items by industry. The Geographic Area Series is the only series that provides this data at a U.S. summary level as well as an economic place level; other geographies included are states, combined statistical areas, metropolitan statistical areas and counties.
Tuesday, November 3, 2015
At Least 350 Languages Spoken in U.S. Homes
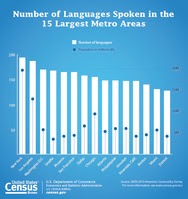
Most Comprehensive Language Data Ever Released from the Census Bureau
U.S. Census Bureau released a set of new tables today detailing hundreds of languages that U.S. residents speak at home. American Community Survey data on languages spoken at home were previously available for only 39 languages. These tables, based on American Community Survey data collected from 2009 to 2013, expand the languages and language groups tabulated to 350.
These tables are among the most comprehensive data ever released from the Census Bureau on languages spoken less widely in the United States, such as Pennsylvania Dutch, Ukrainian, Turkish, Romanian, Amharic and many others. Also included are 150 different Native North American languages, collectively spoken by more than 350,000 people, including Yupik, Dakota, Apache, Keres and Cherokee.
|
Monday, November 2, 2015
American Indian and Alaska Native Heritage Month: November 2015
The first American Indian Day was celebrated in May 1916 in New York. Red Fox James, a Blackfeet Indian, rode horseback from state to state, getting endorsements from 24 state governments, to have a day to honor American Indians. In 1990, President George H.W. Bush signed a joint congressional resolution designating November 1990 as “National American Indian Heritage Month.” Similar proclamations have been issued every year since 1994. This Facts for Features presents statistics for American Indians and Alaska Natives, as this is one of the six major race categories classified by the U.S. Office of Management and Budget.
Population
5.4 million
The nation’s population of American Indians and Alaska Natives, including those of more than one race. They made up about 2 percent of the total population in 2014. Of this total, about 48 percent were American Indian and Alaska Native only, and about 52 percent were American Indian and Alaska Native in combination with one or more other races. Source: 2014 American Community Survey <http://factfinder.census.gov/
Thursday, October 29, 2015
Social Media Usage: 2005-2015
Nearly two-thirds of American adults (65%) use social networking sites, up from 7% when Pew Research Center began systematically tracking social media usage in 2005...
A special analysis of 27 national surveys of Americans across the past decade documents this substantial spread of technology throughout the population, although the overall number of users of social networking sites has leveled off since 2013.1 At the same time, there continues to be growth in social media usage among some groups that were not among the earliest adopters, including older Americans.
The figures reported here are for social media usage among all adults, not just among those Americans who are internet users. In many previous Pew Research reports, the share of social media users has been reported as the proportion of internet users who had adopted such sites, rather than the full adult population, which continues to include a relatively small share (currently 15%) who still remain offline. In this report, a broader picture of the American landscape is presented, and so the figures are based on the entire adult population.
Read more at:Pew Research Center
Wednesday, October 28, 2015
Global Wealth Report 2015
Now in its sixth edition, the Credit Suisse Global Wealth Report is the most comprehensive and up-to-date source of information on global household wealth. This year, the United States continued adding to global wealth at an impressive rate, with solid growth also evident in China. Elsewhere, local currency wealth gains were offset by depreciation against the US dollar, so that world wealth declined overall by USD 12.4 trillion. The share of financial assets rose again as a percentage of total wealth and may help explain why wealth inequality is edging upwards. The top 1% of wealth holders now own half of all household wealth.
Read more at:Credit Suisse
Tuesday, October 27, 2015
Halloween: Oct. 31, 2015
Halloween, which dates back to Celtic rituals thousands of years ago, has long been associated with images of witches, ghosts and vampires. Today, Halloween has evolved into a celebration characterized by child-friendly activities, such as costumes, trick-or-treating and carving pumpkins into jack-o’-lanterns.
Trick or Treat!
41.2 million
The estimated number of potential trick-or-treaters in 2014 — children age 5 to 14 — across the U.S. Of course, many other children — older than 14 and younger than 5 — also go trick-or-treating. Source: U.S. Census Bureau, 2014 Population Estimates, PEPASR6H <http://factfinder.census.gov/
117.3 million
Number of occupied housing units across the nation in second quarter 2015 — all potential stops for trick-or-treaters. Source: U.S. Census Bureau, Housing Vacancies and Homeownership, Table 8 <http://www.census.gov/
78.7%
Percentage of U.S. households that agreed that their neighbors could be trusted in 2013. Source: 2013 American Housing Survey <http://www.census.gov/
Subscribe to:
Posts (Atom)