|
Showing posts with label children. Show all posts
Showing posts with label children. Show all posts
Wednesday, November 30, 2016
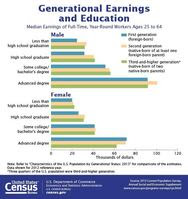
Children of Foreign-Born Parents More Likely to Be College-Educated Than Their Parents
Monday, August 10, 2015
2015 KIDS COUNT Data Book
The Annie E. Casey Foundation’s annual report on child well-being — the 2015 KIDS COUNT Data Book — focuses on the state of America’s children in the midst of the country's economic recovery. While data show improvements in child health and education, more families are struggling to make ends meet, and a growing number of kids live in high-poverty neighborhoods. In addition to ranking states in several areas of child well-being, the Data Book also examines the influence of parents’ education, health and other life circumstances on their children.
You can access the Data Book and related materials HERE.
You can access the Data Book and related materials HERE.
Friday, March 27, 2015
Measuring America: A Child’s Day
At A Glance infographic uses statistics from the Survey of Income and Program Participation to examine aspects of a child’s well-being, including participation in extracurricular activities, academic experiences, meals with a parent and being read to. Internet address: <http://census.gov/library/
Wednesday, December 17, 2014
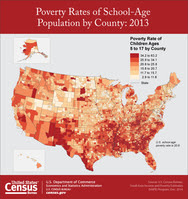
How School-Age Child Poverty in Every County Compares with Prerecession Levels
|
Tuesday, December 9, 2014
Nearly 6 Out of 10 Children Participate in Extracurricular Activities

Fifty-seven percent of children between 6 and 17 years old participate in at least one after-school extracurricular activity, according to a new report released today from the U.S. Census Bureau. The report found that children were more likely to participate in sports (35 percent) than clubs or lessons like music, dance and language (both around 29 percent).
A Child’s Day: Living Arrangements, Nativity, and Family Transitions: 2011 uses statistics from the Survey of Income and Program Participation to examine aspects of a child’s well-being, examining their participation in extracurricular activities, and how participation related to a child’s living arrangements, parental nativity status and household or economic transitions.
|
Thursday, July 3, 2014
The Worst State in America for Black Children
From Identities.MIC:

Black families pondering a move to the Midwest might want to read this, especially if they have young children. According to a national report, Wisconsin has been ranked the worst state in the country when it comes to racial disparities for children.
The Annie E. Casey Foundation, a 66-year-old charitable organization concentrating on family issues and well-being, spearheaded the study. "Race for Results: Building a Path to Opportunity for All Children" scored states according to 12 different factors, from educational access to socioeconomic status and home life.
Wisconsin scored a 238 on its ability to prepare black children for educational and financial success, the lowest of all states (the average score was 345). Interestingly, Wisconsin was ranked 10th overall in its preparation for white children.
Saturday, March 22, 2014
Teaching Kids About Taxes: What Are They and Why Do We Pay Them
It’s that time of year when adults are getting paperwork organized and talking about taxes. Kids may be wondering what all the fuss is about. Here is a lesson plan for grades 3 - 5 that can be used to explain what income, property, and sales taxes are and why we pay them.
The IRS has a comprehensive website for teachers and students from middle school through college.
The IRS has a comprehensive website for teachers and students from middle school through college.
Friday, February 14, 2014
The science behind a happy relationship
Regardless of how happy you are in a current relationship (and trust us, you'll find some fascinating facts on how marriage and kids can affect your happiness levels at different stages)--the main takeaway is that there are small changes you can make in your interactions that can boost your relationship satisfaction for the long run.
See the infographic from Happify.
See the infographic from Happify.
Monday, November 25, 2013
America's Families and Living Arrangements: 2013
The U.S. Census Bureau reports that 76 percent of American parents living with children under 18 are married. Another 16 percent have no partner present, and 8 percent cohabit with a partner.
Among parents living with an unmarried partner, two-thirds (66 percent) share a biological child with their partner.
This information comes from America’s Families and Living Arrangements: 2013, tabulations released using data from the 2013 Annual Social and Economic Supplement to the Current Population Survey. The table package provides a current portrait of the composition of families and households and shows historical changes in living arrangements in the United States. New this year is a table that profiles American parents living with their children.
The table shows that living arrangements are different for mothers than for fathers. Fathers living with their children are much more likely to have a spouse present (86 percent) than mothers (67 percent), while 25 percent of mothers with children under 18 have no partner present, compared with only 6 percent of fathers.
“Mothers are more likely than fathers to be raising a child without a partner present and fathers are less likely to live with their children,” said Jamie Lewis, a demographer with the Census Bureau’s Fertility and Family Statistics Branch. In 2013, 36.6 million mothers and 28.7 million fathers resided with children under 18. This includes both married and unmarried parents.
Other highlights:
Sixty-six percent of households in 2013 were family households, compared with 81 percent in 1970. Family households include two or more people (one of which is the householder) living under the same roof related by blood, marriage or adoption; it does not have to include anyone who is married.
Between 1970 and 2013, the share of households that were married couples with children decreased by about half from 40 to 19 percent; the proportion of married couples without children dipped slightly, from 30 to 29 percent.
The proportion of one-person households increased by 10 percentage points between 1970 and 2013, from 17 percent to 27 percent.
Between 1970 and 2013, the average number of people per household declined from 3.1 to 2.5. During the same period, the average number of children per family decreased from 1.3 to 0.9.
The median age at first marriage in 2013 was 29.0 for men and 26.6 for women, up from 23.2 for men and 20.8 for women in 1970.
In 2013, 48 percent of children living with a mother only, had a never-married mother, up from 7 percent in 1970.
Seven percent of American households are maintained by a cohabiting couple. More than one-third (37 percent) of cohabiting-couple households contain children under 18.
Most children under 18 (64 percent) live with married parents; 96 percent of children under 18 live with at least one parent.
Black (55 percent) and Hispanic children (31 percent) are more likely to live with one parent than non-Hispanic white (20 percent) or Asian children (13 percent).
Children living with neither parent (47 percent) or with a mother only (45 percent) are most likely to be below poverty, followed by those living with a father only (21 percent), and those living with two parents (13 percent). The estimates for children living with neither parent and those with a mother only are not significantly different.
Of the 73.9 million children in the United States in 2013, approximately 7.1 million (10 percent) lived with a grandparent. Of children living with a grandparent, 20 percent did not have a parent present.
Forty percent of married parents with children under 18 had at least a bachelor’s degree.
Sunday, June 30, 2013
Older Americans Don't Like Living with Children
From the New Strategist:
That's a shocking statement, but it is supported by research findings: people aged 65 or older who live with children under age 18 are unhappier, angrier, more worried and stressed out than those who do not live with children--even after controlling for factors that might cause negative emotions.
In the delightfully titled study, Grandpa and the Snapper: The Wellbeing of the Elderly Who Live with Children, NBER researchers Angus Deaton and Arthur A. Stone examine data from the Gallup Healthways Wellbeing Index. They measure the happiness, enjoyment, worry, and stress of people who live with and without children under age 18. Younger adults gain both pleasure and pain from living with children, but for the elderly it's all pain and no pleasure.
"Our evidence suggests that living with children under 18 is associated with worse outcomes on all measures," say the researchers. "None of this is to argue that some elderly do not take pleasure in their grandchildren or in the children of those with whom they live. But, on average, we can find no evidence of it."
Thursday, June 6, 2013
Briefing Paper on Bullying
While discourse on bullying is predominantly focused on developed countries or those that are high or very high on the Human Development Index, the fact is it occurs everywhere, in every country on the globe. As increasing numbers of young people have begun socializing through the internet, using social networking websites, cyber bulling too has become a significant vehicle for abuse and violence. Children and young people around the world suffer from bullying, both in the real world as well as the virtual world. Children and young people subjected to bullying can feel depressed, anxious, dejected and may suffer from personality disorders, suicidal and self-harm tendencies.
With growing awareness amongst children and young people about bullying, contacts with child helplines on this issue are rising. In this briefing paper, Child Helpline International (CHI) has compiled statistics and information on contacts about bullying that child helplines have received since 2003. Based on 126 million contacts made with member child helplines, Child Helpline International has analysed the different aspects of bullying disaggregated at different levels – global and regional— taking into account the gender of the victim and the perpetrators.
With growing awareness amongst children and young people about bullying, contacts with child helplines on this issue are rising. In this briefing paper, Child Helpline International (CHI) has compiled statistics and information on contacts about bullying that child helplines have received since 2003. Based on 126 million contacts made with member child helplines, Child Helpline International has analysed the different aspects of bullying disaggregated at different levels – global and regional— taking into account the gender of the victim and the perpetrators.
Friday, April 12, 2013
U.S. ranks near bottom of UNICEF report on child well-being
The United States ranked in the bottom four of a United Nations report on child well-being. Among 29 countries, America landed second from the bottom in child poverty and held a similarly dismal position when it came to “child life satisfaction.”
Keeping the U.S. company at the bottom of the report, which gauged material well-being, overall health, access to housing and education, were Lithuania, Latvia and Romania, three of the poorest countries in the survey.
UNICEF said in a statement on the survey that child poverty in countries like the U.S. “is not inevitable but is policy-susceptible” and that there isn’t necessarily a strong relationship between per capita GDP and overall child well-being,
More HERE or HERE>
Tuesday, October 23, 2012
The puzzling case of boys who are hitting puberty earlier
From the New York Times:
A large study released by the American Academy of Pediatrics suggests that boys are entering puberty earlier now than several decades ago — or at least earlier than the time frame doctors have historically used as a benchmark.
The study, widely considered the most reliable attempt to measure puberty in American boys, estimates that boys are showing signs of puberty six months to two years earlier than was reported in previous research, which historically taught that 11 ½ was the general age puberty began in boys. But experts cautioned that because previous studies were smaller or used different approaches, it is difficult to say how much earlier boys might be developing.
The study echoes research on girls, which has now established a scientific consensus that they are showing breast development earlier than in the past.
Wednesday, August 8, 2012
2012 Kids Count Data Book
From the Annie E. Casey Foundation
Each year, the Annie E. Casey Foundation publishes the KIDS COUNT Data Book, which tracks the well-being of our nation’s children, state by state. As we release this year’s Data Book, our 23rd, America’s children and families face a crossroad. After the worst economic crisis since the Great Depression, our economy has begun to slowly recover. Unemployment has declined and state revenues are trending upward. But the recovery is fragile. Many families are still coping with hardship caused by a long and deep recession, and states and localities still face serious fiscal challenges.
Each year, the Annie E. Casey Foundation publishes the KIDS COUNT Data Book, which tracks the well-being of our nation’s children, state by state. As we release this year’s Data Book, our 23rd, America’s children and families face a crossroad. After the worst economic crisis since the Great Depression, our economy has begun to slowly recover. Unemployment has declined and state revenues are trending upward. But the recovery is fragile. Many families are still coping with hardship caused by a long and deep recession, and states and localities still face serious fiscal challenges.
Thursday, August 2, 2012
First-Time Kindergartners in 2010-11
This brief report from the US Department of Education provides a demographic profile of the students who attended kindergarten in the United States in the 2010-11 school year using data from the Early Childhood Longitudinal Study, Kindergarten Class of 2010-11 (ECLS-K:2011). The ECLS-K:2011 cohort includes students in public and private schools across the United States, students who attended part-day and full-day kindergarten programs, and students who were attending their first year of kindergarten as well as those who were repeating kindergarten. The analyses presented in this report focus on the 3.5 million students who were attending kindergarten for the first time in the 2010-11 school year. Approximately 5 percent of the students in the ECLS-K:2011 cohort were repeating kindergarten and are not represented in the findings in this report.
The ECLS-K:2011 is a longitudinal study that will follow a nationally representative sample of students from their kindergarten year to the spring of 2016, when most of them are expected to be in fifth grade. During the first year of data collection, when all children were in kindergarten, data were collected in both the fall and the spring. Approximately 18,200 children enrolled in 970 schools during the 2010-11 school year participated during the kindergarten year.
The study will provide information on students’ status at entry to school, their transition into school, and their progression through the elementary grades. The longitudinal nature of the ECLS-K:2011 data will enable researchers to study how a wide range of family, school, community, and individual factors are associated with educational, socioemotional, and physical development over time. Information is being collected from the students, their parents/guardians, their teachers, their school administrators, and their before- and after-school care providers.
Saturday, December 10, 2011
One-Third of Fathers with Working Wives Regularly Care for Their Children
Among fathers with a wife in the workforce, 32 percent were a regular source of care for their children under age 15, up from 26 percent in 2002, the U.S. Census Bureau reported today. Among these fathers with preschool-age children, one in five fathers was the primary caregiver, meaning their child spent more time in their care than any other type of arrangement.
The series of tables titled Who’s Minding the Kids? Child Care Arrangements: Spring 2010 showed that in a typical week, 12.2 million (61 percent) of the 20 million children under age 5 were in some type of regular child care arrangement.
As married women have increasingly moved into the labor force, fathers have become more available for child care while their wives are working.
“A recession may force families to adjust their child care arrangements, “said Lynda Laughlin, a family demographer at the Census Bureau. “It can trigger unemployment or changes in work hours, thus increasing the availability of fathers to provide child care. It also can reduce available income to pay for child care outside of the home.”
The tables provide statistics on child care arrangements of preschoolers and grade-schoolers by various demographic characteristics of the employed and nonemployed mothers. They also examine the characteristics of children who care for themselves on a regular basis as well as how the cost of weekly child care varies based on selected family characteristics.
Other highlights:
In households with working moms, family members continue to serve as an important source of child care for preschoolers. In spring of 2010, 30 percent of preschoolers were regularly cared for by their grandparents, 29 percent were cared for by their fathers, and 12 percent received care from a sibling or other relative.
Preschoolers with employed black and Hispanic mothers were more likely to be cared for by their grandparents than their fathers. Twenty-nine percent of black preschoolers were cared for by their grandparents, while a quarter (22 percent) were cared for by their fathers. A third of Hispanic preschoolers were regularly taken care of by their grandparent, compared with 29 percent who received care from their fathers.
Among preschoolers of employed non-Hispanic white mothers, 30 percent were cared for by their fathers and 29 percent were cared for by their grandparents.
Of the 21 million mothers who were employed in the spring of 2010, one-third reported they paid for child care for at least one of their children.
Families with an employed mother and children younger than 15 paid an average of $138 per week for child care in 2010, up from $81 in 1985 (in constant 2010 dollars), the first year that these data were collected.
Mothers with children under age 5 were more likely to make child care payments than mothers who only had children between the ages of 5 and 14 (47 percent and 23 percent, respectively).
Families in poverty who paid for care in 2010 spent a greater proportion of their monthly income on child care than did families at or above the poverty line (40 percent compared with 7 percent).
Among all children, self-care was much more prevalent among middle school-age children than among those in elementary schools: 10 percent of ages 5 to 11 and 30 percent of ages 12 to 14 regularly cared for themselves.
This report is one of several related to children and families to have been released recently or that will be released soon by the Census Bureau, including Custodial Mothers and Fathers and Their Child Support: 2009; Maternity Leave and Employment Patterns of First-Time Mothers: 1961-2008; and Comparing Program Participation of TANF and non-TANF Families Before and During a Time of Recession.
Tuesday, August 23, 2011
Children's Well Being
A number of reports released this month about children.
From the Annie E. Casey Foundation - 2011 Kids Count Data Book: National and State-By-State Data on Key Indicators of Child Well-Being
From the Census Bureau - A Child’s Day: 2009
From the National Center for Health Statistics - Summary Health Statistics for U.S. Children: National Health Interview Survey, 2010 [PDF]
From the Agency for Healthcare Research & Quality - Hospital Stays for Children, 2009 [PDF]
Saturday, July 9, 2011
Children's Dental Care: Advice and Checkups, 2008
This Statistical Brief provides analysis for dental visits among children ages 2-17 and the advice given by doctors to the parents of children for their dental checkups and frequency of routine checkups. In terms of following the doctor's advice to have routine dental checkups, only about half (49.3 percent) of the children received them.
Friday, July 8, 2011
Living Arrangements of Children: 2009
This report [PDF] from the Census Bureau examines the diversity of children’s living arrangements in households in the United States. The data are from the household relationship module of the Survey of Income and Program Participation (SIPP) collected in early 2009. This is an update of an earlier report based on data from the 2004 SIPP Panel.
Tuesday, December 7, 2010
Basic Facts About Low-income Children, 2009
Source: National Center for Children in Poverty
Children represent 25 percent of the population. Yet, they comprise 36 percent of all people in poverty. Among children, 42 percent live in low-income families and approximately one in every five live in poor families. Winding up in a low-income or poor family does not happen by chance. There are significant factors related to children’s experiences with economic insecurity, such as race/ethnicity and parents’ education and employment. This fact sheet describes the demographic, socio-economic, and geographic characteristics of children and their parents – highlighting the important factors that appear to distinguish low-income and poor children from their less disadvantaged counterparts.
Children represent 25 percent of the population. Yet, they comprise 36 percent of all people in poverty. Among children, 42 percent live in low-income families and approximately one in every five live in poor families. Winding up in a low-income or poor family does not happen by chance. There are significant factors related to children’s experiences with economic insecurity, such as race/ethnicity and parents’ education and employment. This fact sheet describes the demographic, socio-economic, and geographic characteristics of children and their parents – highlighting the important factors that appear to distinguish low-income and poor children from their less disadvantaged counterparts.
Subscribe to:
Comments (Atom)