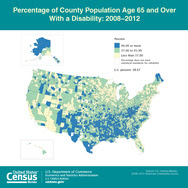
Nearly 40 percent of people age 65 and older had at least one disability, according to a U.S. Census Bureau report that covered the period 2008 to 2012. Of those 15.7 million people, two-thirds of them say they had difficulty in walking or climbing.
Difficulty with independent living, such as visiting a doctor’s office or shopping, was the second-most cited disability, followed by serious difficulty in hearing, cognitive difficulty, difficulty bathing or dressing, and serious difficulty seeing.
While populous states such as California, Florida, New York and Texas had the largest number of older people with a disability, high disability rates were seen in Southern counties, especially in central Appalachia and the Mississippi Delta.
Older Americans With a Disability: 2008-2012, a report based on data collected during the American Community Survey, examines disability status by age, sex and selected socio-economic characteristics, such as marital status, living arrangement, educational attainment and poverty status.
“The statistics provided in this report can help anticipate future disability prevalence in the older population,” said Wan He, a demographer from the Census Bureau’s Population Division. “The figures can be used to help the older population with a disability, their families, and society at-large plan strategies and prepare for daily life tasks and old-age care.”
Highlights:
· More than half (54.4 percent) of the older population who had not graduated from high school had a disability, twice the rate of those with a bachelor’s degree or higher (26.0 percent). This inverse relationship between educational attainment and likelihood of having a disability was found across age, sex, race and Hispanic origin.
· More than one-third of those 85 and older with a disability lived alone, compared with one-fourth of those age 65 to 74.
· About 13 percent of the older household population with a disability lived in poverty; in contrast, 7 percent of those without a disability were in poverty.
· The older population with a disability was disproportionately concentrated among those 85 and older. This group represented 13.6 percent of the total older population but accounted for 25.4 percent of the older population with a disability.
· Women 65 and older were more likely than men 65 and older to have five of the six types of disability included in the American Community Survey, especially ambulatory difficulty. Older women’s higher rates for disability are, in part, because women live longer.
· Older men’s higher likelihood for having a hearing disability may reflect the lifelong occupational differentials between men and women, where men may be more likely to have worked in industries that cause noise-induced hearing loss.
· Disability rates were lower for married older people than for those widowed or in other categories of marital status.
The Division of Behavioral and Social Research at the National Institute on Aging of the National Institutes of Health commissioned this report and also supports other Census Bureau reports on aging research.
About the American Community Survey
The American Community Survey is the only source of small area estimates for social and demographic characteristics. It gives communities the current information they need to plan investments and services. Retailers, homebuilders, police departments, and town and city planners are among the many private- and public-sector decision makers who count on these annual results. Visit the Stats in Action page to see some examples.
These statistics would not be possible without the participation of the randomly selected households in the survey.
|
Monday, January 5, 2015
Mobility is Most Common Disability Among Older Americans
Subscribe to:
Post Comments (Atom)
No comments:
Post a Comment