A new study by Columbia Engineering School will help urban planners, policy makers, and engineers understand the local dynamics of building energy use in New York City—where over two-thirds of the energy consumption is from buildings—and help jumpstart the exchange of ideas.
Model Created to Map Energy Use in NYC Buildings
Monday, February 6, 2012

Saturday, February 4, 2012
Copyright Clearance Center Announces Motion Picture License
The CCC, in partnership with the Motion Picture Licensing Corporation (MPLC), developed the Motion Picture License to meet the diverse needs of businesses and their employees and reduce the risk of unintended copyright infringement.
The Motion Picture License allows one to show motion pictures legally in an organization for sales meetings, employee training and development programs, company functions and more while respecting the rights of content creators.
More HERE.
The Motion Picture License allows one to show motion pictures legally in an organization for sales meetings, employee training and development programs, company functions and more while respecting the rights of content creators.
More HERE.
Thursday, February 2, 2012
Study Reveals Gender Gap over Social Media Privacy
Most women using social media are just as willing to reveal personal information about their relationships, jobs, brand preferences and political and religious affiliations as men — but when it comes to details like phone numbers, location, and email or physical address that might put their personal security at risk, women are significantly more wary than men.
More HERE.
More HERE.
Wednesday, February 1, 2012
Housing Vacancies and Homeownership
Homeownership Rate (HR)
The homeownership rate in the third quarter 2011 (66.3 percent) was lower than the third quarter 2010 rate (66.9 percent). The homeownership rates in the Midwest and South were lower than their corresponding third quarter 2010 rates.
Rental Vacancy Rate (RVR)
The rental vacancy rate in the fourth quarter 2011 (9.4 percent) was approximately the same as the fourth quarter 2010 rate (9.4 percent).
Homeowner Vacancy Rate (HVR)
The homeowner vacancy rate of 2.3 percent in fourth quarter 2011 was lower than the fourth quarter 2010 rate (2.7 percent).p>
4th Qtr 2011
(HR): 66.0 percent
3rd Qtr 2011
(HR): 66.5 percent
More HERE.
The homeownership rate in the third quarter 2011 (66.3 percent) was lower than the third quarter 2010 rate (66.9 percent). The homeownership rates in the Midwest and South were lower than their corresponding third quarter 2010 rates.
Rental Vacancy Rate (RVR)
The rental vacancy rate in the fourth quarter 2011 (9.4 percent) was approximately the same as the fourth quarter 2010 rate (9.4 percent).
Homeowner Vacancy Rate (HVR)
The homeowner vacancy rate of 2.3 percent in fourth quarter 2011 was lower than the fourth quarter 2010 rate (2.7 percent).p>
4th Qtr 2011
(HR): 66.0 percent
3rd Qtr 2011
(HR): 66.5 percent
More HERE.
Tuesday, January 31, 2012
State Economic Profiles 2011
The Office of Advocacy’s Small Business Profiles for the States and Territories supply data on small businesses in each of the 50 states and the District of Columbia. The publication also provides national-level data and limited data on the U.S. territories. The usefulness of the publication is the great detail it provides about small businesses at the state level. The following topics are covered: the number of firms, demographics of business ownership, small business income, banking, business turnover, industry composition, and employment gains and losses by size of business.
2011 Small Business Profiles for the States and Territories
2011 Small Business Profiles for New York State [PDF]
2011 Small Business Profiles for the States and Territories
2011 Small Business Profiles for New York State [PDF]
Monday, January 30, 2012
Market concentration: the Herfindahl-Hirschman Index calculator
"Since 1982, the U.S. Department of Justice, the Federal Trade Commission, and state attorneys general have used the Herfindahl-Hirschman Index (HHI) to measure market concentration for purposes of antitrust enforcement. The HHI of a market is calculated by summing the squares of the percentage market shares held by the respective firms. For example, an industry consisting of two firms with market shares of 70% and 30% has an HHI of 70²+30², or 5800.
"According to the DOJ-FTC 2010 Horizontal Merger Guidelines, the agencies will regard a market in which the post-merger HHI is below 1500 as 'unconcentrated,' between 1500 and 2500 as 'moderately concentrated,' and above 2500 as 'highly concentrated.'"
See the tool HERE.
"According to the DOJ-FTC 2010 Horizontal Merger Guidelines, the agencies will regard a market in which the post-merger HHI is below 1500 as 'unconcentrated,' between 1500 and 2500 as 'moderately concentrated,' and above 2500 as 'highly concentrated.'"
See the tool HERE.
Sunday, January 29, 2012
How to call NYC's 311 when you're not in NYC
311 is New York City's main source of government information and non-emergency services. Whether you're a resident, business owner, or visitor, help is just a click, text, or call away.
Call 212) NEW-YORK (212-639-9675) from outside New York City.
There are also text, Skype, TTY, Twitter, and iPhone app options.
More HERE.
Call 212) NEW-YORK (212-639-9675) from outside New York City.
There are also text, Skype, TTY, Twitter, and iPhone app options.
More HERE.
Saturday, January 28, 2012
Proposed NYS Senate & Assembly districts available in GIS format
The New York State Legislative Task Force on Demographic Research and Reapportionment (commonly known as "LATFOR") has published its proposed new lines for State Senate and Assembly districts based on the decennial 2010 Census.
LATFOR posted its proposed district maps in PDF format, and also provided "block assignment lists" to delineate the proposed districts. The block lists indicate which Census blocks (the smallest level of Census geography) correspond to which district. But the Task Force didn't make the maps available in a format that you can easily use with mapping software or online maps.
In order to enable others to visualize and analyze these districts on maps, the Center for Urban Research (CUR) at the CUNY Graduate Center has converted these lists into two formats compatible with desktop and online mapping applications: "shapefiles" and KML files. (Shapefiles are commonly used by most desktop geographic information system, or GIS, software packages. KML files are used typically in Google Maps, Google Earth, and other online mapping applications.)
More HERE.
LATFOR posted its proposed district maps in PDF format, and also provided "block assignment lists" to delineate the proposed districts. The block lists indicate which Census blocks (the smallest level of Census geography) correspond to which district. But the Task Force didn't make the maps available in a format that you can easily use with mapping software or online maps.
In order to enable others to visualize and analyze these districts on maps, the Center for Urban Research (CUR) at the CUNY Graduate Center has converted these lists into two formats compatible with desktop and online mapping applications: "shapefiles" and KML files. (Shapefiles are commonly used by most desktop geographic information system, or GIS, software packages. KML files are used typically in Google Maps, Google Earth, and other online mapping applications.)
More HERE.
Friday, January 27, 2012
Global Employment Trends 2012: Preventing a deeper jobs crisis
The world faces the "urgent challenge" of creating 600 million productive jobs over the next decade in order to generate sustainable growth and maintain social cohesion, according to the annual report on global employment by the International Labour Organization (ILO).
"After three years of continuous crisis conditions in global labour markets and against the prospect of a further deterioration of economic activity, there is a backlog of global unemployment of 200 million," says the ILO in its annual report titled Global Employment Trends 2012: Preventing a deeper jobs crisis. Moreover, the report says more than 400 million new jobs will be needed over the next decade to absorb the estimated 40 million growth of the labour force each year.
"After three years of continuous crisis conditions in global labour markets and against the prospect of a further deterioration of economic activity, there is a backlog of global unemployment of 200 million," says the ILO in its annual report titled Global Employment Trends 2012: Preventing a deeper jobs crisis. Moreover, the report says more than 400 million new jobs will be needed over the next decade to absorb the estimated 40 million growth of the labour force each year.
Thursday, January 26, 2012
Annual Energy Outlook 2012 - early release overview
From the Energy Information Agency
Projections in the Annual Energy Outlook 2012 (AEO2012) Reference case focus on the factors that shape U.S. energy markets in the long term, under the assumption that current laws and regulations remain generally unchanged throughout the projection period. The AEO2012 Reference case provides the basis for examination and discussion of energy market trends and serves as a starting point for analysis of potential changes in U.S. energy policies, rules, or regulations or potential technology breakthroughs.
This release is an abridged version of the Annual Energy Outlook that highlights changes in the AEO Reference case projections for key energy topics. The Early Release includes data tables for the Reference case only. The full AEO2012 will be released April 26, 2012.
Projections in the Annual Energy Outlook 2012 (AEO2012) Reference case focus on the factors that shape U.S. energy markets in the long term, under the assumption that current laws and regulations remain generally unchanged throughout the projection period. The AEO2012 Reference case provides the basis for examination and discussion of energy market trends and serves as a starting point for analysis of potential changes in U.S. energy policies, rules, or regulations or potential technology breakthroughs.
This release is an abridged version of the Annual Energy Outlook that highlights changes in the AEO Reference case projections for key energy topics. The Early Release includes data tables for the Reference case only. The full AEO2012 will be released April 26, 2012.
Wednesday, January 25, 2012
The National Fish, Wildlife and Plants Climate Adaptation (draft)
Source: U.S. Department of the Interior
In response to increasing impacts of climate change and other stressors on America’s natural resources, the United States Congress has called for the development of a national, government-wide strategy to safeguard fish, wildlife, plants, and the natural systems upon which they depend.
In response to increasing impacts of climate change and other stressors on America’s natural resources, the United States Congress has called for the development of a national, government-wide strategy to safeguard fish, wildlife, plants, and the natural systems upon which they depend.
Tuesday, January 24, 2012
The Internet, by the numbers
"So what happened with the Internet in 2011? How many email accounts were there in the world in 2011? How many websites? How much did the most expensive domain name cost? How many photos were hosted on Facebook? How many videos were viewed to YouTube?
"We’ve got answers to these questions and many more. A veritable smorgasbord of numbers, statistics and data lies in front of you. Using a variety of sources we’ve compiled what we think are some of the more interesting numbers that describe the Internet in 2011."
More HERE.
"We’ve got answers to these questions and many more. A veritable smorgasbord of numbers, statistics and data lies in front of you. Using a variety of sources we’ve compiled what we think are some of the more interesting numbers that describe the Internet in 2011."
More HERE.
Monday, January 23, 2012
Scarcity of women causes men to spend more, save less
A scarcity of women doesn't just dampen men's spirits — it could hurt their finances, too.
When men think they outnumber women, they borrow more, save less and make more impulse purchases, according to a study published last week by the University of Minnesota's Carlson School of Management.
The rest of the story HERE.
The news release about the study HERE.
When men think they outnumber women, they borrow more, save less and make more impulse purchases, according to a study published last week by the University of Minnesota's Carlson School of Management.
The rest of the story HERE.
The news release about the study HERE.
Saturday, January 21, 2012
Thursday, January 19, 2012
2012 Presidential Primaries, Caucuses, and Conventions
Here is a chronological list of all the Republican and Democratic presidential primaries, caucuses, and conventions in 2012.
There are data to the states' rules. For instance:
Tuesday 24 April 2012 (tentative): 81 of 95 of New York's delegates to the Republican National Convention (3? from each of the state's 28 Congressional Districts) are allocated to presidential contenders in today's New York Presidential Primary.
There are also links to state constitutions, election authority (e.g. state Board of Elections), legislature, political parties and media.
There are data to the states' rules. For instance:
Tuesday 24 April 2012 (tentative): 81 of 95 of New York's delegates to the Republican National Convention (3? from each of the state's 28 Congressional Districts) are allocated to presidential contenders in today's New York Presidential Primary.
There are also links to state constitutions, election authority (e.g. state Board of Elections), legislature, political parties and media.
Wednesday, January 18, 2012
Tuesday, January 17, 2012
Men Rule: The Continued Under-Representation of Women in U. S. Politics
Study after study finds that, when women run for office, they perform just as well as their male counterparts. No differences emerge in women and men’s fundraising receipts, vote totals, or electoral success. Yet women remain severely under-represented in U.S. political institutions. We argue that the fundamental reason for women’s under-representation is that they do not run for office. There is a substantial gender gap in political ambition; men tend to have it, and women don’t.
More HERE [PDF].
(Thanks to Dustbury.
More HERE [PDF].
(Thanks to Dustbury.
Monday, January 16, 2012
Friday, January 13, 2012
Thursday, January 12, 2012
New Files Make American FactFinder Your One Stop for Key Census Bureau Data
The new American FactFinder, the U.S. Census Bureau’s statistics and information search engine introduced one year ago, has been updated with files formerly found in its “legacy” version. Users now have access to more than 60 important data sets in the new FactFinder English interface and 14 data sets in the Spanish interface.
“Users no longer have to navigate between two Web tools,” Census Bureau Director Robert Groves said. “They now have one stop for the most important data sets from the Census Bureau.”
Nearly all of the information from the older version has been uploaded to the new American FactFinder website. At your fingertips, you now will have access to more than 250 billion data cells and statistics for more than —
- 40,000 tables
- 1,500 population groups and tribes
- 80,000 business and industry codes
- 12 million geographies for each decennial census
The new American FactFinder provides users with one-stop access to results from the decennial census (2010 and 2000), the economic census (2002 and 2007), American Community Survey, population estimates and key annual economic surveys. American FactFinder has statistics on a variety of topics, such as income, poverty, education, and housing.
Census staff are aware of customer issues with the new American Fact Finder and are working on both short term and long term solutions to address these issues, improve search and navigation, and enhance customer satisfaction
Eventually, the 2010 Census Equal Employment Opportunity File, the American Housing Survey and the census of governments statistics will be released through the new American FactFinder.
This expansion has permitted the Census Bureau to retire the original version of American FactFinder on Jan. 20 after 12 years of service. Several files will be available only on the Census Bureau FTP (file transfer protocol) site.
Any deep links or bookmarks in the older version of American FactFinder no longer work. The Census Bureau held a webinar to discuss the transfer of files to the new American FactFinder and provide guidance on building deep links, searching and bookmarking in the new site, as well as accessing the information that had previously been on the legacy FactFinder through an archived FTP site. For those who missed it, an archived version will be available in the next few days HERE.
If you need a few facts in a hurry, you can look at Quick Facts, which give you fast, easy statistics about people, business, and geography. If you are a new user of census data, this may give you what you need in a simple, easy-to-navigate format.
“Users no longer have to navigate between two Web tools,” Census Bureau Director Robert Groves said. “They now have one stop for the most important data sets from the Census Bureau.”
Nearly all of the information from the older version has been uploaded to the new American FactFinder website. At your fingertips, you now will have access to more than 250 billion data cells and statistics for more than —
- 40,000 tables
- 1,500 population groups and tribes
- 80,000 business and industry codes
- 12 million geographies for each decennial census
The new American FactFinder provides users with one-stop access to results from the decennial census (2010 and 2000), the economic census (2002 and 2007), American Community Survey, population estimates and key annual economic surveys. American FactFinder has statistics on a variety of topics, such as income, poverty, education, and housing.
Census staff are aware of customer issues with the new American Fact Finder and are working on both short term and long term solutions to address these issues, improve search and navigation, and enhance customer satisfaction
Eventually, the 2010 Census Equal Employment Opportunity File, the American Housing Survey and the census of governments statistics will be released through the new American FactFinder.
This expansion has permitted the Census Bureau to retire the original version of American FactFinder on Jan. 20 after 12 years of service. Several files will be available only on the Census Bureau FTP (file transfer protocol) site.
Any deep links or bookmarks in the older version of American FactFinder no longer work. The Census Bureau held a webinar to discuss the transfer of files to the new American FactFinder and provide guidance on building deep links, searching and bookmarking in the new site, as well as accessing the information that had previously been on the legacy FactFinder through an archived FTP site. For those who missed it, an archived version will be available in the next few days HERE.
If you need a few facts in a hurry, you can look at Quick Facts, which give you fast, easy statistics about people, business, and geography. If you are a new user of census data, this may give you what you need in a simple, easy-to-navigate format.
Wednesday, January 11, 2012
Residential Energy Consumption Survey (RECS)
EIA is releasing new benchmark estimates for home energy use for the year 2009 that include detailed data for 16 States, 12 more than in past EIA residential energy surveys. EIA has conducted the Residential Energy Consumption Survey (RECS) since 1978 to provide data on home energy characteristics, end uses of energy, and expenses for the four Census Regions and nine Divisions. In 1997, EIA produced additional tabulations for the four most populous States (California, New York, Texas, and Florida). A threefold increase in the number of households included in the 2009 RECS offers more accuracy and coverage for understanding energy usage for all estimated States, Regions and Divisions.
More HERE.
More HERE.
Tuesday, January 10, 2012
Revisions to Seasonally Adjusted Household Survey Data
At the end of every calendar year, BLS makes routine revisions to the seasonally adjusted data in the Current Population Survey (CPS), which includes the national unemployment rate. The revisions include all additional information to identify if changes in the data are one-time or seasonal temporary blips as opposed to permanent changes in the numbers. These changes are usually minor and don’t drastically change labor market trends. With this month’s release of the employment situation, BLS made that same set of routine revisions, and as expected, the changes to 2011 data were minor.
More HERE.
More HERE.
Monday, January 9, 2012
ACS questions re: computer & internet usage, parental place of birth
The Census Bureau published a Federal Register notice on December 28, 2011 [PDF], seeking comment on two proposed new topics (questions) for the American Community Survey (ACS) starting in 2013.
The Census Bureau tested these new questions in its 2010 ACS Content Test. The topics are:
1. Computer and internet usage
2. Parental place of birth
Terri Ann Lowenthal, in her Census Project blog, speculated about the implications for census-taking of racial, income, geographic, and other socioeconomic differentials in Internet access and usage.
She writes in an e-mail: "Nonprofits working with immigrant communities might be especially interested in the proposed question on parental place of birth. The justification for both proposed topics is included in the FR notice. The notice also summarizes several other proposed tweaks (the technical term!) to ACS questions starting in 2013.
"Deadline for public comments is February 27, 2012...I urge any organizations supporting these new question topics to submit comments to the Department of Commerce."
The Census Bureau tested these new questions in its 2010 ACS Content Test. The topics are:
1. Computer and internet usage
2. Parental place of birth
Terri Ann Lowenthal, in her Census Project blog, speculated about the implications for census-taking of racial, income, geographic, and other socioeconomic differentials in Internet access and usage.
She writes in an e-mail: "Nonprofits working with immigrant communities might be especially interested in the proposed question on parental place of birth. The justification for both proposed topics is included in the FR notice. The notice also summarizes several other proposed tweaks (the technical term!) to ACS questions starting in 2013.
"Deadline for public comments is February 27, 2012...I urge any organizations supporting these new question topics to submit comments to the Department of Commerce."
Saturday, January 7, 2012
How Moving Companies are Changing the U.S. Landscape
A recent post here was about infographics; there is also a post about the 2010 Census reporting record low mover rates. The infographic here visualizes the Census trend.
Friday, January 6, 2012
New and Improved Features on Census.gov Home Page
Some of the new features you will find include:
A top drop-down menu for quick navigation to key topics.
An embeddable dashboard in the upper right corner featuring our economic indicators. Reporters can subscribe to receive automatic updates.
A prominent "Census News" section in the middle of the page.
A new interactive map showing in-depth business and demographic information for the nation, states and counties.
A "Stat of the Day" highlighting statistics across all the data collected by the Census Bureau.
A top drop-down menu for quick navigation to key topics.
An embeddable dashboard in the upper right corner featuring our economic indicators. Reporters can subscribe to receive automatic updates.
A prominent "Census News" section in the middle of the page.
A new interactive map showing in-depth business and demographic information for the nation, states and counties.
A "Stat of the Day" highlighting statistics across all the data collected by the Census Bureau.
Thursday, January 5, 2012
OpenSecrets.org - looking at dollars flowing thru political campaigns
With the presidential election on the far horizon, political campaigns will be front page news for the next several months, and a big part of the political news will focus on money: who is raising it, who is giving it, who is spending it, and what they are spending it on.
OpenSecrets.org, produced by the Center for Responsive Politics, provides an easy way to look at the dollars flowing through the campaigns, using data from the Federal Election Commission. This comprehensive website covers presidential, house and senate campaign finance, offering detailed fundraising profiles for each candidate, with rankings of donating industries and major contributors. PAC money is accounted for, with data on “outside spending” supporting and opposing the candidate, and head-to-head comparisons of presidential candidates allow you to directly compare, for example, the key industries donating to Santorum with those supporting Obama. For representatives and senators, comparisons to congressional fund-raising averages are provided, along with a listing of bills sponsored and co-sponsored.
OpenSecrets.org offers extensive and well organized information on campaign finance. The data is easily readable, and illustrated by graphs. If you are wondering where all the money comes from, Open Secrets.org will open the books for you.
OpenSecrets.org, produced by the Center for Responsive Politics, provides an easy way to look at the dollars flowing through the campaigns, using data from the Federal Election Commission. This comprehensive website covers presidential, house and senate campaign finance, offering detailed fundraising profiles for each candidate, with rankings of donating industries and major contributors. PAC money is accounted for, with data on “outside spending” supporting and opposing the candidate, and head-to-head comparisons of presidential candidates allow you to directly compare, for example, the key industries donating to Santorum with those supporting Obama. For representatives and senators, comparisons to congressional fund-raising averages are provided, along with a listing of bills sponsored and co-sponsored.
OpenSecrets.org offers extensive and well organized information on campaign finance. The data is easily readable, and illustrated by graphs. If you are wondering where all the money comes from, Open Secrets.org will open the books for you.
Wednesday, January 4, 2012
Finding Place in Making Connections Communities
Foundation- and government-sponsored initiatives often want to help disadvantaged neighborhoods and families in tandem. Yet many do not connect with their constituencies because the initiatives find target areas through census tracts and the like, which seldom match residents' definitions of their neighborhoods. Claudia J. Coulton, Tsui Chan, and Kristen Mikelbank (Case Western Reserve University) survey residents from 10 cities served by the Annie E. Casey Making Connections initiative, then employ GIS tools to discover the spaces residents call their neighborhoods as well as compare them with external definitions.
More HERE
See also: The Awkward Art of Neighborhood Naming
(Thanks to CG Hill
More HERE
See also: The Awkward Art of Neighborhood Naming
(Thanks to CG Hill
Tuesday, January 3, 2012
Infographics are hardly new
Data Visualisation may be a hot topic right now, but a new poster show at London's Transport Museum reminds us that getting complex information over in attractive ways is not a new challenge for the art director or designer MORE.
Monday, January 2, 2012
World Giving Index 2011 : A Global View of Giving Trends
Source: Charities Aid Foundation
This is the second edition of the 'World Giving Index', the largest study into charitable behaviour across the globe involving 153 countries in total.Using data from Gallup's Worldview World Poll, the report is based on three measures of giving behaviour - giving money, volunteering time and helping a stranger.
The results show that the USA is officially the most charitable nation in the world.
This is the second edition of the 'World Giving Index', the largest study into charitable behaviour across the globe involving 153 countries in total.Using data from Gallup's Worldview World Poll, the report is based on three measures of giving behaviour - giving money, volunteering time and helping a stranger.
The results show that the USA is officially the most charitable nation in the world.
Friday, December 30, 2011
Matching Supply to Demand: Addressing the U.S. Primary Care Workforce Shortage
While there is little debate about a growing primary care workforce shortage in the United States, precise estimates of current and projected need vary. A secondary problem contributing to addressing capacity shortfalls is that the distribution of primary care practitioners often is mismatched with patient needs. For example, patients in rural areas or low-income patients—particularly the uninsured—may have greater problems accessing primary care services than well-insured, suburban residents. ... While existing, longer-term efforts to boost the primary care workforce are necessary, they may be insufficient for some time because a meaningful increase in practitioners will take decades. Rather, policy makers may want to consider ways to increase the productivity of primary care providers and accelerate primary care workforce expansion by, for example, examining how changes in state scope-of-practice policies might increase the supply of non-physician practitioners.
Full report [PDF]
Full report [PDF]
Thursday, December 29, 2011
2010 Annual Survey of State Government Finances
Total state government revenue increased to $2.0 trillion in 2010, up 79.0 percent from $1.1 trillion in 2009, resulting mainly from large increases in social insurance trust revenue, according to the latest findings from the U.S. Census Bureau [PDF]. After a substantial loss in earnings in 2009, trust systems showed earnings of $450.5 billion in 2010, a gain of 218.2 percent over the year before.
Two major sources make up these trust systems: (1) employee retirement systems and (2) federal and state social insurance trust systems, which include the unemployment compensation system, state government worker's compensation programs, Social Security, Medicare, veteran's life insurance and railroad retirement.
Earnings on these systems vary widely year to year because state retirement systems invest heavily in financial markets and respond to shifts in market performance.
View the publication page for summary, tax, lottery and other data.
Two major sources make up these trust systems: (1) employee retirement systems and (2) federal and state social insurance trust systems, which include the unemployment compensation system, state government worker's compensation programs, Social Security, Medicare, veteran's life insurance and railroad retirement.
Earnings on these systems vary widely year to year because state retirement systems invest heavily in financial markets and respond to shifts in market performance.
View the publication page for summary, tax, lottery and other data.
Wednesday, December 28, 2011
Governmental Tracking of Cell Phones and Vehicles: The Confluence of Privacy, Technology, and Law
This report [PDF] will briefly survey Fourth Amendment law as it pertains to the government's tracking programs. It will then summarize federal electronic surveillance statutes and the case law surrounding cell phone location tracking. Next, the report will describe the GPS-vehicle tracking cases and review the pending Supreme Court GPS tracking case, United States v. Jones. Finally, the report will summarize the geolocation and electronic surveillance legislation introduced in the 112th Congress.
Tuesday, December 27, 2011
Major changes to Harmonized System coming in 2012
Did you know that there are major changes to the Harmonized System (HS) taking place in 2012? The bulk of the changes are in food-related chapters (1-21). Other chapters with notable changes include:
Water-pipe tobacco (24)
Biodiesel (27 and 38)
Mercury compounds (=> 28)
Water-jet cutting machines (85)
Video game machines (95)
Diapers, etc. (96)
Visit Export.gov to find out more.
Water-pipe tobacco (24)
Biodiesel (27 and 38)
Mercury compounds (=> 28)
Water-jet cutting machines (85)
Video game machines (95)
Diapers, etc. (96)
Visit Export.gov to find out more.
Monday, December 26, 2011
Regents Advisory Council for Libraries issues second draft of Creating the Future, a 2020 Vision

Saturday, December 24, 2011
Learn online about health & wellness from the National Library of Medicine
The National Library of Medicine can help you learn about the symptoms, diagnosis, and treatment for a variety of diseases and conditions. From Abdominal Aortic Aneurysms to Varicose Veins, and many topics in between.
Created for patients, you can learn about the symptoms, diagnosis and treatment for a variety of diseases and conditions. Also learn about surgeries, prevention and wellness.
Each tutorial includes animated graphics, audio, and easy-to-read language
Created for patients, you can learn about the symptoms, diagnosis and treatment for a variety of diseases and conditions. Also learn about surgeries, prevention and wellness.
Each tutorial includes animated graphics, audio, and easy-to-read language
Friday, December 23, 2011
Bureau of Justice Statistics
- Capital Punishment, 2010 - Statistical Tables
- Census of Jail Facilities, 2006
- Correctional Population in the United States, 2010
- Federal Justice Statistics, 2009
- Federal Justice Statistics, 2009 - Statistical Tables
- Justice Expenditures and Employment, 1982-2007 - Statistical Tables
- Prisoners in 2010
- Women in the Labor Force: A Databook (2011 Edition)
Thursday, December 22, 2011
New York State Statistical Yearbook
The New York State Statistical Yearbook provides more than 700 pages of data, tables, graphs and maps on the state's people, economy and government, as well as selected comparisons with other states. Who needs this information? Members of the news media, government officials, citizens and others. The data enhance understanding of the economic and social environment in which state government operates. Such improved understanding is increasingly important as tough decisions must be made in a challenging fiscal climate.
Originated 35 years ago as a joint project of the Rockefeller Institute and the state Division of the Budget, the Statistical Yearbook is now available both in print and online, where data appear in both Excel spreadsheet and PDF format. The Institute is exploring options for placing additional relevant data about New York State government online.
Originated 35 years ago as a joint project of the Rockefeller Institute and the state Division of the Budget, the Statistical Yearbook is now available both in print and online, where data appear in both Excel spreadsheet and PDF format. The Institute is exploring options for placing additional relevant data about New York State government online.
Wednesday, December 21, 2011
Department of Agriculture - Economic Research Service
Estimates of farm sector income with component accounts: for the United States, 1910-2011; and for States, 1949-2010. Data are released three times a year. The next release will include the 2012 farm income and balance sheet forecast. The release is scheduled for mid February.
Overview
Estimates are presented of the farm sector's income generated by employment of the sector's resource base in production activities and its contribution as a key component sector of the national economy for 1910 to the present. The national farm income account is disaggregated into component accounts to provide insight into the financial performance of the diverse production activities, participants, and geographic regions of the country. Economic trends can be determined and analyzed using data related to production and marketing of commodities, expenditures for types of inputs, income for States, income by size of farm, and the role of government in supporting the sector. A complete set of estimates is provided for each State.
Data Files
Major data categories are value-added (farm income), cash receipts, rankings for commodities and States, production expenses, cash income, government payments, and income statements by size of farm. The historical estimates are conceptually the same as the farm income forecast and thus provide a lengthy time series for analysis of the sector's current financial health, trends, and outlook.
See all data files...
Release Schedule
Updates are made in mid February, late August, and late November.
Glossary
Check the glossary for explanations of the economic concepts used throughout farm income and costs data.
Questions and Answers
Q. Why are the ERS income estimates referred to as farm sector accounts?
A. The farm income accounts measure the earnings from all production activities in the farm sector as defined by the Bureau of Economic Analysis (BEA) for national income accounting.
Q. Are the ERS income estimates comparable to income reported by farmers to the Internal Revenue Service?
A. No. The conceptual framework underlying the ERS value-added accounts through which farm income is estimated is consistent with the BEA's national income accounting. Also, data are not available to duplicate taxable income accounting because of confidentiality requirements associated with tax filings.
Link to web page here.
Tuesday, December 20, 2011
Agricultural Commodities Areas
For more than 90 years, AMS has provided current, unbiased price and sales information to assist in the orderly marketing and distribution of farm commodities. Reports include information on prices, volume, quality, condition, and other market data on farm products in specific markets and marketing areas. Reports cover both domestic and international markets. The data is disseminated within hours of collection via the Internet and made available through electronic means, in printed reports, by telephone recordings and through the news media.
In particular, check out the Commodities Area, which provides current prices for COTTON, DAIRY, FRUIT AND VEGETABLE and LIVESTOCK AND SEED.
In particular, check out the Commodities Area, which provides current prices for COTTON, DAIRY, FRUIT AND VEGETABLE and LIVESTOCK AND SEED.
Monday, December 19, 2011
America's Health Rankings 2011
Health is a result of our behaviors, our individual genetic predisposition to disease, the environment and the community in which we live, the clinical care we receive and the policies and practices of our health care and prevention systems. Each of us — individually, as a community, and as a society — strives to optimize these health determinants, so that all of us can have a long, disease-free and robust life regardless of race, gender or socioeconomic status.Direct link to full report
This report looks at the four groups of health determinants that can be affected:
- Behaviors include the everyday activities we do that affect our personal health.
- Community and environment reflects the reality that the daily conditions in which we live our lives have a great effect on achieving optimal individual health.
- Public and health policies are indicative of the availability of resources to encourage and maintain health and the extent that public and health programs reach into the general population.
- Clinical care reflects the quality, appropriateness and cost of the care we receive at doctors' offices, clinics and hospitals.
Saturday, December 17, 2011
Center files motion for leave to appeal in FOIL lawsuit
The Empire Center for New York State Policy has asked the state's highest court to review an appellate decision that would hide public information from public view. The Center's efforts have been bolstered by an amicus brief filed on behalf of the state's leading newspapers.
In an October 18 ruling, the Appellate Division of state Supreme Court in Manhattan denied the Empire Center's appeal of a lower court decision in favor of the New York City Police Pension Fund, which had refused to comply with the Empire Center's Freedom of Information Law (FOIL) request for a list of the fund's pension recipients.
The full release can be viewed here.
In an October 18 ruling, the Appellate Division of state Supreme Court in Manhattan denied the Empire Center's appeal of a lower court decision in favor of the New York City Police Pension Fund, which had refused to comply with the Empire Center's Freedom of Information Law (FOIL) request for a list of the fund's pension recipients.
The full release can be viewed here.
Films on the 1940 Censuses
The history buffs among us will find this interesting. There are two films (about 3 and 11 minutes) promoting participation in the 1940 Census. Note the reference to collecting all of the data within one month. Of course, this was all done by list enumerate methods instead of mail-out/mail-back.
Friday, December 16, 2011
Legacy Version of American FactFinder will Retire January 20, 2012
What Will Happen?
The Legacy Version of American FactFinder will be discontinued January 20, 2012.
=============
How will this affect you?
Any deep links into the discontinued system will no longer work.
1. Deep links to specific products from these datasets will not be available:
1990 Census
2000-2004 American Community Survey
2000-2001 Supplementary Survey
1997 Economic Census
2003 Annual Survey of Manufactures
2003 Nonemployer Statistics
2. These products will only be available through an archived FTP format. Instructions on how to access these archived products will be provided in future updates.
3. All other current and previous year data from the American Community Survey, Puerto Rico Community Survey, Annual Population Estimates, Economic Census, and Annual Economic Surveys are available at http://factfinder2.census.gov.
=============
What do you need to do?
Use the how-to guide for Building Deep Links into the New American Factfinder to create links to the NEW American FactFinder.
Look for additional updates in the coming weeks.
The Legacy Version of American FactFinder will be discontinued January 20, 2012.
=============
How will this affect you?
Any deep links into the discontinued system will no longer work.
1. Deep links to specific products from these datasets will not be available:
1990 Census
2000-2004 American Community Survey
2000-2001 Supplementary Survey
1997 Economic Census
2003 Annual Survey of Manufactures
2003 Nonemployer Statistics
2. These products will only be available through an archived FTP format. Instructions on how to access these archived products will be provided in future updates.
3. All other current and previous year data from the American Community Survey, Puerto Rico Community Survey, Annual Population Estimates, Economic Census, and Annual Economic Surveys are available at http://factfinder2.census.gov.
=============
What do you need to do?
Use the how-to guide for Building Deep Links into the New American Factfinder to create links to the NEW American FactFinder.
Look for additional updates in the coming weeks.
Make. An American Manufacturing Movement
In this global, consumer-oriented and knowledge-intensive economy, the
competitiveness of U.S. manufacturing has never been more uncertain or
important – nor have policy prescriptions been more contentious. All
Americans would benefit from getting this right. A new era of
manufacturing excellence offers hope for good jobs, new innovations and a
higher standard of living. America would benefit from faster economic
growth, a more secure industrial and defense base, and an ability to
produce solutions to national challenges in energy, health and
environment.
Link to full report.
Link to full report.
Thursday, December 15, 2011
Areas With Concentrated Poverty: 2006–2010
People living in poverty tend to be clustered in certain neighborhoods
rather than being evenly distributed across geographic areas. Measuring
this concentration of poverty is important because researchers have
found that living in areas with many other poor people places burdens on
low-income families beyond what the families' own individual
circumstances would dictate. Many argue that this concentration of
poverty results in higher crime rates, underperforming public schools,
poor housing and health conditions, as well as limited access to private
services
Direct link to full report
Direct link to full report
Wednesday, December 14, 2011
The Open Knowledge Foundation: Open Data Means Better Science
Multiple individuals, groups, and organisations are involved in a major movement to reform the process of scientific communication. The promotion of open access and open data and the development of platforms that reduce the cost and difficulty of data handling play a principal role in this.
One such organisation is the Working Group on Open Data in Science (also known as the Open Science Working Group) at the Open Knowledge Foundation (OKF). The OKF is a community-based organisation that promotes open knowledge, which encompasses open data, free culture, the public domain, and other areas of the knowledge commons. Founded in 2004, the organisation has grown into an international network of communities that develop tools, applications, and guidelines enabling the opening up of data, and subsequently the discovery and use of that data.
Link to publication page for additional viewing and downloading options
One such organisation is the Working Group on Open Data in Science (also known as the Open Science Working Group) at the Open Knowledge Foundation (OKF). The OKF is a community-based organisation that promotes open knowledge, which encompasses open data, free culture, the public domain, and other areas of the knowledge commons. Founded in 2004, the organisation has grown into an international network of communities that develop tools, applications, and guidelines enabling the opening up of data, and subsequently the discovery and use of that data.
Link to publication page for additional viewing and downloading options
Tuesday, December 13, 2011
Unauthorized Immigrants: Length of Residency, Patterns of Parenthood
Nearly two-thirds of the 10.2 million unauthorized adult immigrants in the United States have lived in this country for at least 10 years and nearly half are parents of minor children, according to new estimates by the Pew Hispanic Center, a project of the Pew Research Center.
These estimates are based on data from the U.S. Census Bureau’s March 2010 Current Population Survey, augmented with the Center’s analysis of the demographic characteristics of the unauthorized immigrant population using a "residual estimation methodology" that the Center has employed for many years.
Full Report PDF
Monday, December 12, 2011
Identity Theft Reported by Households, 2005-2010
An estimated 8.6 million households had at least one person age 12 or older who experienced identity theft victimization in 2010, the Bureau of Justice Statistics (BJS) announced today. This was an increase from the 6.4 million households victimized in 2005.
Identity theft is the unauthorized use or attempted use of an existing credit card or another type of existing account, the unauthorized use of personal information to open a new account or for another fraudulent purpose, or a combination of these.
The unauthorized use of an existing credit card accounted for much of the increase in household identity theft from 2005 to 2010. The number of households experiencing the misuse of an existing credit card rose from about 3.6 million in 2005 to 5.5 million in 2010.
View the publication web page for additional formats and information
Sunday, December 11, 2011
NY ranked second in employee pay, 26th in per capita cost
The average pay for state workers in New York was $55,662 in 2010, according to the report, released Friday by the Center for Government Research, based on an analysis of U.S. Census of Governments data.
Saturday, December 10, 2011
One-Third of Fathers with Working Wives Regularly Care for Their Children
Among fathers with a wife in the workforce, 32 percent were a regular source of care for their children under age 15, up from 26 percent in 2002, the U.S. Census Bureau reported today. Among these fathers with preschool-age children, one in five fathers was the primary caregiver, meaning their child spent more time in their care than any other type of arrangement.
The series of tables titled Who’s Minding the Kids? Child Care Arrangements: Spring 2010 showed that in a typical week, 12.2 million (61 percent) of the 20 million children under age 5 were in some type of regular child care arrangement.
As married women have increasingly moved into the labor force, fathers have become more available for child care while their wives are working.
“A recession may force families to adjust their child care arrangements, “said Lynda Laughlin, a family demographer at the Census Bureau. “It can trigger unemployment or changes in work hours, thus increasing the availability of fathers to provide child care. It also can reduce available income to pay for child care outside of the home.”
The tables provide statistics on child care arrangements of preschoolers and grade-schoolers by various demographic characteristics of the employed and nonemployed mothers. They also examine the characteristics of children who care for themselves on a regular basis as well as how the cost of weekly child care varies based on selected family characteristics.
Other highlights:
In households with working moms, family members continue to serve as an important source of child care for preschoolers. In spring of 2010, 30 percent of preschoolers were regularly cared for by their grandparents, 29 percent were cared for by their fathers, and 12 percent received care from a sibling or other relative.
Preschoolers with employed black and Hispanic mothers were more likely to be cared for by their grandparents than their fathers. Twenty-nine percent of black preschoolers were cared for by their grandparents, while a quarter (22 percent) were cared for by their fathers. A third of Hispanic preschoolers were regularly taken care of by their grandparent, compared with 29 percent who received care from their fathers.
Among preschoolers of employed non-Hispanic white mothers, 30 percent were cared for by their fathers and 29 percent were cared for by their grandparents.
Of the 21 million mothers who were employed in the spring of 2010, one-third reported they paid for child care for at least one of their children.
Families with an employed mother and children younger than 15 paid an average of $138 per week for child care in 2010, up from $81 in 1985 (in constant 2010 dollars), the first year that these data were collected.
Mothers with children under age 5 were more likely to make child care payments than mothers who only had children between the ages of 5 and 14 (47 percent and 23 percent, respectively).
Families in poverty who paid for care in 2010 spent a greater proportion of their monthly income on child care than did families at or above the poverty line (40 percent compared with 7 percent).
Among all children, self-care was much more prevalent among middle school-age children than among those in elementary schools: 10 percent of ages 5 to 11 and 30 percent of ages 12 to 14 regularly cared for themselves.
This report is one of several related to children and families to have been released recently or that will be released soon by the Census Bureau, including Custodial Mothers and Fathers and Their Child Support: 2009; Maternity Leave and Employment Patterns of First-Time Mothers: 1961-2008; and Comparing Program Participation of TANF and non-TANF Families Before and During a Time of Recession.
The series of tables titled Who’s Minding the Kids? Child Care Arrangements: Spring 2010 showed that in a typical week, 12.2 million (61 percent) of the 20 million children under age 5 were in some type of regular child care arrangement.
As married women have increasingly moved into the labor force, fathers have become more available for child care while their wives are working.
“A recession may force families to adjust their child care arrangements, “said Lynda Laughlin, a family demographer at the Census Bureau. “It can trigger unemployment or changes in work hours, thus increasing the availability of fathers to provide child care. It also can reduce available income to pay for child care outside of the home.”
The tables provide statistics on child care arrangements of preschoolers and grade-schoolers by various demographic characteristics of the employed and nonemployed mothers. They also examine the characteristics of children who care for themselves on a regular basis as well as how the cost of weekly child care varies based on selected family characteristics.
Other highlights:
In households with working moms, family members continue to serve as an important source of child care for preschoolers. In spring of 2010, 30 percent of preschoolers were regularly cared for by their grandparents, 29 percent were cared for by their fathers, and 12 percent received care from a sibling or other relative.
Preschoolers with employed black and Hispanic mothers were more likely to be cared for by their grandparents than their fathers. Twenty-nine percent of black preschoolers were cared for by their grandparents, while a quarter (22 percent) were cared for by their fathers. A third of Hispanic preschoolers were regularly taken care of by their grandparent, compared with 29 percent who received care from their fathers.
Among preschoolers of employed non-Hispanic white mothers, 30 percent were cared for by their fathers and 29 percent were cared for by their grandparents.
Of the 21 million mothers who were employed in the spring of 2010, one-third reported they paid for child care for at least one of their children.
Families with an employed mother and children younger than 15 paid an average of $138 per week for child care in 2010, up from $81 in 1985 (in constant 2010 dollars), the first year that these data were collected.
Mothers with children under age 5 were more likely to make child care payments than mothers who only had children between the ages of 5 and 14 (47 percent and 23 percent, respectively).
Families in poverty who paid for care in 2010 spent a greater proportion of their monthly income on child care than did families at or above the poverty line (40 percent compared with 7 percent).
Among all children, self-care was much more prevalent among middle school-age children than among those in elementary schools: 10 percent of ages 5 to 11 and 30 percent of ages 12 to 14 regularly cared for themselves.
This report is one of several related to children and families to have been released recently or that will be released soon by the Census Bureau, including Custodial Mothers and Fathers and Their Child Support: 2009; Maternity Leave and Employment Patterns of First-Time Mothers: 1961-2008; and Comparing Program Participation of TANF and non-TANF Families Before and During a Time of Recession.
Friday, December 9, 2011
Fall 2011 Statistics of Income Bulletin
The Internal Revenue Service announced availability of the fall 2011 issue of the Statistics of Income Bulletin, which features data for 140.5 million individual income tax returns filed for tax year 2009. Adjusted gross income (AGI) reported on these returns totaled $7.6 trillion.
The Statistics of Income (SOI) Division produces the SOI Bulletin on a quarterly basis. Articles included in the publication provide the most recent data available from various tax and information returns filed by U.S. taxpayers. This issue of the SOI Bulletin also includes articles on the following:
- Partnership returns. For tax year 2009, more than 3 million partnerships filed federal tax returns, reporting $18.8 trillion in total assets and almost $410 billion in total net income.
- Municipal bonds. The majority of municipal bonds were tax-exempt governmental bonds, of which there were 22,000 issued in 2009, raising $340.7 billion in proceeds for public projects, such as schools, transportation infrastructure and utilities.
- Charities, Social Clubs, and Other Tax-Exempt Organizations. For 2008, nonprofit charitable organizations, excluding private foundations, reported $2.5 trillion in total assets and $1.4 trillion in revenue.
Thursday, December 8, 2011
The Nation's Forest Census
The Forest Inventory and Analysis (FIA) Program of the U.S. Forest Service provides the information needed to assess America's forests.
For world numbers, go to the UN's FAO.
For world numbers, go to the UN's FAO.
Wednesday, December 7, 2011
Comprehensive Analysis of Fast-Growing 90-and-Older Population
The nation’s 90-and-older population nearly tripled over the past three decades, reaching 1.9 million in 2010, according to a report by the U.S. Census Bureau and supported by the National Institute on Aging. Over the next four decades, this population is projected to more than quadruple.
Because of increases in life expectancy at older ages, people 90 and older now comprise 4.7 percent of the older population (age 65 and older), as compared with only 2.8 percent in 1980. By 2050, this share is likely to reach 10 percent.
The majority of people 90 and older report having one or more disabilities, living alone or in a nursing home and graduating from high school. People in this age group also are more likely to be women and to have higher widowhood, poverty and disability rates than people just under this age cutoff.
These findings come from 90+ in the United States: 2006-2008, which presents an overview of this age group and a comparative analysis of selected demographic and socio-economic differences between people 90 and older and their younger counterparts within the older population. Statistics for the report, which go down to the state level, come from the 2006-2008 American Community Survey 3-year estimates and 2008 1-year estimates, as well as census and projections data.
“Traditionally, the cutoff age for what is considered the ‘oldest old’ has been age 85,” said Census Bureau demographer Wan He, “but increasingly people are living longer and the older population itself is getting older. Given its rapid growth, the 90-and-older population merits a closer look.
“Previously, relatively little research focused on this increasingly important population group, and this report attempts to fill that void,” she continued. “The American Community Survey, with its large sample size in multiyear data sets, allows an in-depth and comprehensive analysis of the characteristics of the 90-and-older population.”
An older person’s likelihood of living in a nursing home increases sharply with age. While about only 1 percent of people in their upper 60s and 3 percent in their upper 70s were nursing home residents, the proportion rose to about 20 percent for those in their lower 90s, more than 30 percent for people in their upper 90s, and nearly 40 percent for centenarians.
While nearly all people in their 90s who lived in a nursing home had a disability (98.2 percent), the vast majority (80.8 percent) of those who did not live in a nursing home also had one or more disabilities. Difficulty doing errands alone and performing general mobility-related activities of walking or climbing stairs were the most common types, which indicates that many who live in households may need assistance with everyday activities.
The proportion of people age 90 to 94 having disabilities is more than 13 percentage points higher than that of 85- to 89-year-olds.
Other highlights:
--Given that people age 90 and older included in the report were born in 1918 or earlier, an unexpectedly high proportion (61.3 percent) had completed high school or above. Nearly 28 percent continued their education beyond high school, about half of whom completed a bachelor’s degree or higher.
--The 90-and-older population is overwhelmingly (88.1 percent) white. Additionally, blacks represented 7.6 percent, Asians 2.2 percent and Hispanics (who may be of any race) about 4 percent.
--The annual median personal income for people 90 and older during 2006-2008 was $14,760 (in 2008 inflation-adjusted dollars). Almost half (47.9 percent) of this amount came from Social Security and another 18.3 percent came from retirement pension income. All in all, 92.3 percent of those 90 and older received income from the Social Security Administration (86.2 percent received Social Security income only with the remainder receiving either Supplemental Security Income only or both).
--In 2006-2008, 14.5 percent of people 90 and older lived in poverty, a higher rate than for those 65-89 (9.6 percent).
--Among the 90-and-older population, women outnumber men by a ratio of nearly 3 to 1. There were 38 men for every 100 women ages 90 to 94, with the ratio dropping to 26 for ages 95 to 99 and 24 for those 100 and older.
--More than 80 percent of women 90 and older were widowed, while more than 40 percent of men this age were married.
--In 2006-2008, half of men 90 and older lived in a household with family members and/or unrelated individuals, less than one-third lived alone, and about 15 percent were in an institutionalized living arrangement such as a nursing home. In contrast, less than one-third of women in this age group lived in a household with family members and/or unrelated individuals, four in 10 lived alone, and another quarter were in institutionalized living arrangements. (See Figure 2.)
--Those 90 and older were almost universally (99.5 percent) covered by health insurance.
Because of increases in life expectancy at older ages, people 90 and older now comprise 4.7 percent of the older population (age 65 and older), as compared with only 2.8 percent in 1980. By 2050, this share is likely to reach 10 percent.
The majority of people 90 and older report having one or more disabilities, living alone or in a nursing home and graduating from high school. People in this age group also are more likely to be women and to have higher widowhood, poverty and disability rates than people just under this age cutoff.
These findings come from 90+ in the United States: 2006-2008, which presents an overview of this age group and a comparative analysis of selected demographic and socio-economic differences between people 90 and older and their younger counterparts within the older population. Statistics for the report, which go down to the state level, come from the 2006-2008 American Community Survey 3-year estimates and 2008 1-year estimates, as well as census and projections data.
“Traditionally, the cutoff age for what is considered the ‘oldest old’ has been age 85,” said Census Bureau demographer Wan He, “but increasingly people are living longer and the older population itself is getting older. Given its rapid growth, the 90-and-older population merits a closer look.
“Previously, relatively little research focused on this increasingly important population group, and this report attempts to fill that void,” she continued. “The American Community Survey, with its large sample size in multiyear data sets, allows an in-depth and comprehensive analysis of the characteristics of the 90-and-older population.”
An older person’s likelihood of living in a nursing home increases sharply with age. While about only 1 percent of people in their upper 60s and 3 percent in their upper 70s were nursing home residents, the proportion rose to about 20 percent for those in their lower 90s, more than 30 percent for people in their upper 90s, and nearly 40 percent for centenarians.
While nearly all people in their 90s who lived in a nursing home had a disability (98.2 percent), the vast majority (80.8 percent) of those who did not live in a nursing home also had one or more disabilities. Difficulty doing errands alone and performing general mobility-related activities of walking or climbing stairs were the most common types, which indicates that many who live in households may need assistance with everyday activities.
The proportion of people age 90 to 94 having disabilities is more than 13 percentage points higher than that of 85- to 89-year-olds.
Other highlights:
--Given that people age 90 and older included in the report were born in 1918 or earlier, an unexpectedly high proportion (61.3 percent) had completed high school or above. Nearly 28 percent continued their education beyond high school, about half of whom completed a bachelor’s degree or higher.
--The 90-and-older population is overwhelmingly (88.1 percent) white. Additionally, blacks represented 7.6 percent, Asians 2.2 percent and Hispanics (who may be of any race) about 4 percent.
--The annual median personal income for people 90 and older during 2006-2008 was $14,760 (in 2008 inflation-adjusted dollars). Almost half (47.9 percent) of this amount came from Social Security and another 18.3 percent came from retirement pension income. All in all, 92.3 percent of those 90 and older received income from the Social Security Administration (86.2 percent received Social Security income only with the remainder receiving either Supplemental Security Income only or both).
--In 2006-2008, 14.5 percent of people 90 and older lived in poverty, a higher rate than for those 65-89 (9.6 percent).
--Among the 90-and-older population, women outnumber men by a ratio of nearly 3 to 1. There were 38 men for every 100 women ages 90 to 94, with the ratio dropping to 26 for ages 95 to 99 and 24 for those 100 and older.
--More than 80 percent of women 90 and older were widowed, while more than 40 percent of men this age were married.
--In 2006-2008, half of men 90 and older lived in a household with family members and/or unrelated individuals, less than one-third lived alone, and about 15 percent were in an institutionalized living arrangement such as a nursing home. In contrast, less than one-third of women in this age group lived in a household with family members and/or unrelated individuals, four in 10 lived alone, and another quarter were in institutionalized living arrangements. (See Figure 2.)
--Those 90 and older were almost universally (99.5 percent) covered by health insurance.
Tuesday, December 6, 2011
Best and Worst Run States in America
For the second year, 24/7 Wall St. has reviewed data on financial health, standard of living and government services by state to determine how well each state is managed. Based on this data, 24/7 Wall St. ranked the 50 states from the best to worst run. The best-run state is Wyoming. The worst-run state is California.
Read more.
Want to guess where New York State ranks?
Read more.
Want to guess where New York State ranks?
Monday, December 5, 2011
Progress and Pitfalls of Diversity on Wall Street
The Center for Urban Research's latest report is The Progress and Pitfalls of Diversity on Wall Street, prepared by Richard Alba, Acting Director of Center for Urban Research, and Joseph Pereira, of the CUNY Data Service. The report considers the financial industry centered in and around New York City as a crucial site for examining one of the major economic challenges for the nation during the next quarter century: the collision between the growing diversity of the college-educated workforce and the historical recruitment and promotion patterns focused on white men. (The report is based on an analysis of census data from 2000 and the 2005-2009 ACS.)
Some key findings include:
1) The white-male share of the core Wall St. workforce is declining over time. For instance, white men were two-thirds of older workers (45 years and older) with high-status occupations in 2000, but they were only 46 percent of younger workers (30 and younger) in 2005-09. The shift has not been altered by the layoffs associated with the economic downturn.
2) In ethno-racial terms, the bulk of diversity on Wall St. is due to the rapidly growing share of Asian workers, who have gone from 5 percent of older core workers in 2000 to 19 percent of younger ones in 2005-09. Latinos have increased their share as well, but African Americans have not.
3) Women are increasing only modestly their presence in the Wall St. workforce, and they remain distinctly underrepresented by comparison with their proportion of the college educated.
4) White men take home the lion’s share of earnings from Wall St. Especially among workers older than 30, ages when earnings can be very high, white men’s median earnings exceed those of other groups by margins that frequently approach or even surpass 2-to-1.
The report notes two possible classes of explanations for the group disparities evident in the Wall St. workforce: minorities and women may differ in the human-capital characteristics required for career trajectories oriented towards top positions, and/or they may be excluded by discrimination, institutional or individual, from these trajectories. Census data cannot tell us which kind of explanation is more important; deciding between them requires other kinds of data, which currently do not exist.
For further information about the report, contact
• Richard Alba at ralba@gc.cuny.edu or 212-817-8773 (cell: 518-727-3475) or
• Joseph Pereira at jpereira@gc.cuny.edu or 212-817-2032
Some key findings include:
1) The white-male share of the core Wall St. workforce is declining over time. For instance, white men were two-thirds of older workers (45 years and older) with high-status occupations in 2000, but they were only 46 percent of younger workers (30 and younger) in 2005-09. The shift has not been altered by the layoffs associated with the economic downturn.
2) In ethno-racial terms, the bulk of diversity on Wall St. is due to the rapidly growing share of Asian workers, who have gone from 5 percent of older core workers in 2000 to 19 percent of younger ones in 2005-09. Latinos have increased their share as well, but African Americans have not.
3) Women are increasing only modestly their presence in the Wall St. workforce, and they remain distinctly underrepresented by comparison with their proportion of the college educated.
4) White men take home the lion’s share of earnings from Wall St. Especially among workers older than 30, ages when earnings can be very high, white men’s median earnings exceed those of other groups by margins that frequently approach or even surpass 2-to-1.
The report notes two possible classes of explanations for the group disparities evident in the Wall St. workforce: minorities and women may differ in the human-capital characteristics required for career trajectories oriented towards top positions, and/or they may be excluded by discrimination, institutional or individual, from these trajectories. Census data cannot tell us which kind of explanation is more important; deciding between them requires other kinds of data, which currently do not exist.
For further information about the report, contact
• Richard Alba at ralba@gc.cuny.edu or 212-817-8773 (cell: 518-727-3475) or
• Joseph Pereira at jpereira@gc.cuny.edu or 212-817-2032
Saturday, December 3, 2011
Economic Benefits of International Education to the United States
Source: NAFSA
Foreign students and their families spent more than $20 billion in the United States during the 2010 – 2011 academic year, according to a new NAFSA report released today. California, New York, and Texas welcomed the largest numbers of foreign students, and those states and others across the country each saw a substantial benefit from spending by these students and their families on living expenses, tuition, and fees.
Foreign students and their families spent more than $20 billion in the United States during the 2010 – 2011 academic year, according to a new NAFSA report released today. California, New York, and Texas welcomed the largest numbers of foreign students, and those states and others across the country each saw a substantial benefit from spending by these students and their families on living expenses, tuition, and fees.
Friday, December 2, 2011
Consumer Guide on the Working Conditions of American Restaurants
Consumer Guide on the Working Conditions of American Restaurants [PDF] is a 30-page guide to working conditions in popular American restaurants, published by Restaurant Opportunities Center United, a worker-rights advocacy group. It tells you whether the staff at the restaurant you're thinking of eating at gives its staff sick-leave, whether they are paid beyond the $2.13 minimum wage for tipped workers, and whether the restaurant has a policy of limiting women, immigrants and people of color to lower-paid "back of the house" jobs.
[Description from Boing Boing]
[Description from Boing Boing]
Thursday, December 1, 2011
A Look at the Foreign-Born Population, Live on C-SPAN
The Census Bureau will be a guest on C-SPAN's "American By the Numbers" segment.
On Friday, Dec. 2, from 8 to 9:00 a..m.., Elizabeth Grieco, chief of the Foreign-Born Population Branch, will appear live on C-SPAN’s “Washington Journal” to discuss the foreign-born population. Her presentation will include a rich mix of statistical visualizations and discussion, including a public call-in segment. This is part of a weekly Friday series called “America By the Numbers” that features the federal statistical agencies.
You are invited to tune in and watch the program. C-SPAN is available live through the Internet.
For more information and to view the presentation graphs, please visit this link, which will be live Friday morning (Dec. 2).
On Friday, Dec. 2, from 8 to 9:00 a..m.., Elizabeth Grieco, chief of the Foreign-Born Population Branch, will appear live on C-SPAN’s “Washington Journal” to discuss the foreign-born population. Her presentation will include a rich mix of statistical visualizations and discussion, including a public call-in segment. This is part of a weekly Friday series called “America By the Numbers” that features the federal statistical agencies.
You are invited to tune in and watch the program. C-SPAN is available live through the Internet.
For more information and to view the presentation graphs, please visit this link, which will be live Friday morning (Dec. 2).
New York State's Property Tax Cap: A Citizens Guide
From the Empire Center for New York State Policy
New York State recently enacted its first-ever cap on the annual growth in local government and school district tax levies. While the tax cap is essentially a simple concept, based on a successful tax limitation in neighboring Massachusetts, the first stages of the implementation process in many communities has inevitably raised many questions about how the law is supposed to work.
New York State's Property Tax Cap: A Citizen's Guide is designed to answer those questions in a short, easy-to-understand format. The booklet includes a summary description of the cap, answers to frequently ask questions, and the full text of the tax cap law itself.
New York State recently enacted its first-ever cap on the annual growth in local government and school district tax levies. While the tax cap is essentially a simple concept, based on a successful tax limitation in neighboring Massachusetts, the first stages of the implementation process in many communities has inevitably raised many questions about how the law is supposed to work.
New York State's Property Tax Cap: A Citizen's Guide is designed to answer those questions in a short, easy-to-understand format. The booklet includes a summary description of the cap, answers to frequently ask questions, and the full text of the tax cap law itself.
Wednesday, November 30, 2011
County and ZIP Business Patterns, via Missouri
The Missouri Census Data Center has downloaded and converted County Business Patterns data for 2007 thru 2009. These data are available at the nation, state, county, CBSA (Metropolitan and Micropolitan Statistical Areas), and ZIP code levels. Access these data via the Uexplore/Dexter utility apps; take advantage of the Datasets.html directory page where all the new data has been forced to the top of the access table.
Tuesday, November 29, 2011
FedEx Express National Service Disruption
From FedEx
The Memphis hub and flight operations experienced substantial disruptions Monday night due to snow and ice. Potential delays are possible for shipment deliveries across the U.S. FedEx is committed to provide service to the best of our ability. Continue to check fedex.com for service updates as well as track the status of your shipment.
Consistent with the provisions of the FedEx Service Guide, the money-back guarantee is suspended for U.S. packages and shipments inbound into the U.S. from international locations with a delivery commitment of Tuesday, Nov. 29, 2011.
The Memphis hub and flight operations experienced substantial disruptions Monday night due to snow and ice. Potential delays are possible for shipment deliveries across the U.S. FedEx is committed to provide service to the best of our ability. Continue to check fedex.com for service updates as well as track the status of your shipment.
Consistent with the provisions of the FedEx Service Guide, the money-back guarantee is suspended for U.S. packages and shipments inbound into the U.S. from international locations with a delivery commitment of Tuesday, Nov. 29, 2011.
WorldOMeters
Real time world statistics. Us, by the numbers, in the world, and in the United States.
Monday, November 28, 2011
Fuel Economy Guide 2012
The U.S. Environmental Protection Agency and U.S. Department of Energy produce the Fuel Economy Guide to help car buyers choose the most fuel-efficient vehicle that meets their needs. ...
This Guide provides annual fuel cost estimates for each vehicle. The estimates are based on the assumptions that you travel 15,000 miles per year (55% under city driving conditions and 45% under highway conditions).
More HERE.
This Guide provides annual fuel cost estimates for each vehicle. The estimates are based on the assumptions that you travel 15,000 miles per year (55% under city driving conditions and 45% under highway conditions).
More HERE.
Sunday, November 27, 2011
Student Debt and the Class of 2010
From the Institute for College Access & Success [PDF]
College seniors who graduated with student loans in 2010 owed an average of $25,250, up five percent from the previous year, according to a new report from the Project on Student Debt at the Institute for College Access & Success. The Class of 2010 also faced the highest unemployment levels for new college graduates in recent history: 9.1 percent.
College seniors who graduated with student loans in 2010 owed an average of $25,250, up five percent from the previous year, according to a new report from the Project on Student Debt at the Institute for College Access & Success. The Class of 2010 also faced the highest unemployment levels for new college graduates in recent history: 9.1 percent.
Saturday, November 26, 2011
Supplement to Education and Synthetic Work-life Earnings
In September, the Census Bureau released a study that examined the economic value of educational attainment by estimating the amount of money that people might earn over the course of a 40-year career given their level of education. In response to the high level of media interest in these findings, the Census Bureau released a series of supplemental tables. These tables include an estimate for the total population — all people regardless of gender, race, and Hispanic origin. They show that a person with bachelor’s degree working full time from ages 25 to 65 would have $1 million more in earnings than a similar person with high school diploma.
Internet address
News release
Report [PDF]
Internet address
News release
Report [PDF]
Friday, November 25, 2011
Bribe Payers Index 2011
From Transparency International:
Bribing public officials when doing business abroad is a regular occurrence, according to a survey of 3,000 business executives from developed and developing countries.
Transparency International’s 2011 Bribe Payers Index ... ranks 28 leading international and regional exporting countries by the likelihood of their firms to bribe abroad. Companies from Russia and China, who invested US $120 billion overseas in 2010, are seen as most likely to pay bribes abroad. Companies from the Netherlands and Switzerland are seen as least likely to bribe.
More HERE.
Bribing public officials when doing business abroad is a regular occurrence, according to a survey of 3,000 business executives from developed and developing countries.
Transparency International’s 2011 Bribe Payers Index ... ranks 28 leading international and regional exporting countries by the likelihood of their firms to bribe abroad. Companies from Russia and China, who invested US $120 billion overseas in 2010, are seen as most likely to pay bribes abroad. Companies from the Netherlands and Switzerland are seen as least likely to bribe.
More HERE.
Thursday, November 24, 2011
Product service codes
Here is a link to Federal Product Service Codes and Federal Supply Codes. Revised Product Service Codes and Federal supply codes Effective 10/01/2011. The red codes expired 09/30/2011 and the blue codes have been added as of 10/01/2011
Product service codes are used by the United States government to describe the products, services, and research and development purchased by the government. Government procurement specialists and government contractors alike require a solid understanding of these codes in order to produce quality partnerships between buyers and suppliers.
Product service codes are used by the United States government to describe the products, services, and research and development purchased by the government. Government procurement specialists and government contractors alike require a solid understanding of these codes in order to produce quality partnerships between buyers and suppliers.
Wednesday, November 23, 2011
Foreign Labor Certification Data Center
The Foreign Labor Certification Data Center includes an Online Wage Library with Download Data Files, plus Foreign Labor Certification (FLC) disclosure data for the Permanent, H-1B, H-2A and H-2B programs.
Tuesday, November 22, 2011
Monday, November 21, 2011
Demographic change in Metropolitan America: 2000 to 2010
The Center for Urban Research -- through its three constituent units: the CUNY Data Service, the CUNY Mapping Service, and the NYC Labor Market Information Service -- has developed a deep understanding of Census data through its academic and applied research projects. Over several decades of using Census data, analyzing it statistically, visualizing it through maps, and working closely with researchers and practitioners engaged in similar efforts, it understands well how myriad constituencies benefit from Census data, whether they need a single citywide population statistic, a comprehensive demographic profile comparing neighborhoods throughout metropolitan areas, or an analysis of official record data linked to Census data for a specific geography.
More HERE.
More HERE.
Sunday, November 20, 2011
Direct and Intermediated Marketing of Local Foods in the US
From the Department of Agriculture - Economic Research Service
PDF
Saturday, November 19, 2011
Crossing the Line: Sexual Harassment at School
The American Association of University Women (AAUW) released Crossing the Line: Sexual Harassment at School, the most comprehensive, nationally representative research conducted in the past 10 years on sexual harassment in middle and high schools. Sexual harassment pervades the lives of students in grades 7–12.
Friday, November 18, 2011
Cyber Security and You
From New York's Libraries Information Network offers this advice from the Office of Cyber Security
1.Use Strong Passwords: Passwords should have at least eight characters and include letters (uppercase and lowercase), numbers and special characters. It is important to maintain separate passwords for different accounts to reduce the likelihood of one password being compromised, which may make other accounts vulnerable as well. Developing good password practices will help keep your personal information and identity secure.
ALSO
2.Limit the Use of External Devices
3.Avoid Phishing and Social Engineering Attempts
4.Be Cautious When Shopping Online
5.Limit the Use of Administrator Accounts
6.Update Your Software
7.Protect and Secure Mobile Devices
8.Enable Your Firewall
9.Use Anti-virus and Anti-spyware Programs
10.Secure Wireless Networks
1.Use Strong Passwords: Passwords should have at least eight characters and include letters (uppercase and lowercase), numbers and special characters. It is important to maintain separate passwords for different accounts to reduce the likelihood of one password being compromised, which may make other accounts vulnerable as well. Developing good password practices will help keep your personal information and identity secure.
ALSO
2.Limit the Use of External Devices
3.Avoid Phishing and Social Engineering Attempts
4.Be Cautious When Shopping Online
5.Limit the Use of Administrator Accounts
6.Update Your Software
7.Protect and Secure Mobile Devices
8.Enable Your Firewall
9.Use Anti-virus and Anti-spyware Programs
10.Secure Wireless Networks
Mover Rate Reaches Record Low
The percentage of people who changed residences between 2010 and 2011 ─ 11.6 percent ─ was the lowest recorded rate since the Current Population Survey began collecting statistics on the movement of people in the United States in 1948, the U.S. Census Bureau reported today. The rate, which was 20.2 percent in 1985, declined to a then-record low of 11.9 percent in 2008 before rising to 12.5 percent in 2009. The 2010 rate was not statistically different than the 2009 rate.
This information comes from Geographical Mobility: 2011, a collection of national- and regional-level tables from the Current Population Survey Annual Social and Economic Supplement. The tables shed light on movement of people within the United States from one location to another during the year prior to the survey. These tables were part of four migration-related data products released today, which also included:
Geographical Mobility: 2008 to 2009 [PDF], a report with analysis of various geographic mobility topics. It contains national- and state-level data from the 2009 Current Population Survey and American Community Survey.
2010 American Community Survey state-to-state migration flow tables.
Lifetime Mobility in the United States: 2010 [PDF], a 2010 American Community Survey brief on people who live in the state of their birth.
“Taken together, these products paint a vivid picture of a nation on the move and tell a more complete story than any one of them can separately,” said Alison Fields, chief of the Census Bureau's Journey-to-Work and Migration Statistics Branch. “The record low mover rate was driven by a drop in the likelihood of people moving from one location to another within the same county. The last time this rate was so low, the overall mover rate also reached a record low.”
Reasons for Moving
For those who moved to a different county or state, the reasons for moving varied considerably by the length of their move. According to Geographical Mobility: 2008 to 2009, when people moved a considerable distance between 2008 and 2009 ─ 500 or more miles ─ it was most likely for employment-related reasons, which were cited by 43.9 percent of such movers, as opposed to housing-related reasons, given by 11.6 percent. Conversely, when people didn’t move far ─ less than 50 miles ─ 40.0 percent did so for housing-related reasons.
Living in State of Birth
As of 2010, the majority of Americans (59 percent) lived in the state in which they were born, so says Lifetime Mobility in the United States: 2010. The state with the highest such percentage was Louisiana (78.8 percent), followed by Michigan (76.6 percent), Ohio (75.1 percent) and Pennsylvania (74.0 percent). Conversely, in four states ─ Alaska, Arizona, Florida and Nevada ─ and in the District of Columbia, fewer than 40 percent of residents were born in that state or state-equivalent. Nevada, with less than a quarter, had the lowest percentage in the nation.
The Most Common State-to-State Moves
According to the 2010 American Community Survey, 45.3 million people lived in a different house within the United States one year earlier. Of these movers, 6.7 million lived in a different state. The most common state-to-state moves in 2010 were:
California to Texas (68,959 movers)
New York to Florida (55,011)
Florida to Georgia (49,901)
California to Arizona (47,164)
New Jersey to Pennsylvania (42,456)
New York to New Jersey (41,374)
California to Washington (39,468)
Texas to California (36,582)
Georgia to Florida (35,615)
California to Nevada (35,472)
It should be noted that flows in the top 10 may not be significantly different from each other or flows outside the top 10.
Four years earlier, in the wake of Hurricane Katrina, the most common move was Louisiana to Texas (118,552 moves). Among the next largest moves were New York to Florida (87,576) and California to Arizona (85,497). All in all, 7.9 million people moved between states during the 2005 to 2006 period.
In early 2012, the Census Bureau will release the American Community Survey 2005-2009 County-to-County Migration Flow File, the first data set addressing this topic since the 2000 Census. It will show the number of moves between pairs of counties, with tabulations provided by age, sex, and race and Hispanic origin.
This information comes from Geographical Mobility: 2011, a collection of national- and regional-level tables from the Current Population Survey Annual Social and Economic Supplement. The tables shed light on movement of people within the United States from one location to another during the year prior to the survey. These tables were part of four migration-related data products released today, which also included:
Geographical Mobility: 2008 to 2009 [PDF], a report with analysis of various geographic mobility topics. It contains national- and state-level data from the 2009 Current Population Survey and American Community Survey.
2010 American Community Survey state-to-state migration flow tables.
Lifetime Mobility in the United States: 2010 [PDF], a 2010 American Community Survey brief on people who live in the state of their birth.
“Taken together, these products paint a vivid picture of a nation on the move and tell a more complete story than any one of them can separately,” said Alison Fields, chief of the Census Bureau's Journey-to-Work and Migration Statistics Branch. “The record low mover rate was driven by a drop in the likelihood of people moving from one location to another within the same county. The last time this rate was so low, the overall mover rate also reached a record low.”
Reasons for Moving
For those who moved to a different county or state, the reasons for moving varied considerably by the length of their move. According to Geographical Mobility: 2008 to 2009, when people moved a considerable distance between 2008 and 2009 ─ 500 or more miles ─ it was most likely for employment-related reasons, which were cited by 43.9 percent of such movers, as opposed to housing-related reasons, given by 11.6 percent. Conversely, when people didn’t move far ─ less than 50 miles ─ 40.0 percent did so for housing-related reasons.
Living in State of Birth
As of 2010, the majority of Americans (59 percent) lived in the state in which they were born, so says Lifetime Mobility in the United States: 2010. The state with the highest such percentage was Louisiana (78.8 percent), followed by Michigan (76.6 percent), Ohio (75.1 percent) and Pennsylvania (74.0 percent). Conversely, in four states ─ Alaska, Arizona, Florida and Nevada ─ and in the District of Columbia, fewer than 40 percent of residents were born in that state or state-equivalent. Nevada, with less than a quarter, had the lowest percentage in the nation.
The Most Common State-to-State Moves
According to the 2010 American Community Survey, 45.3 million people lived in a different house within the United States one year earlier. Of these movers, 6.7 million lived in a different state. The most common state-to-state moves in 2010 were:
California to Texas (68,959 movers)
New York to Florida (55,011)
Florida to Georgia (49,901)
California to Arizona (47,164)
New Jersey to Pennsylvania (42,456)
New York to New Jersey (41,374)
California to Washington (39,468)
Texas to California (36,582)
Georgia to Florida (35,615)
California to Nevada (35,472)
It should be noted that flows in the top 10 may not be significantly different from each other or flows outside the top 10.
Four years earlier, in the wake of Hurricane Katrina, the most common move was Louisiana to Texas (118,552 moves). Among the next largest moves were New York to Florida (87,576) and California to Arizona (85,497). All in all, 7.9 million people moved between states during the 2005 to 2006 period.
In early 2012, the Census Bureau will release the American Community Survey 2005-2009 County-to-County Migration Flow File, the first data set addressing this topic since the 2000 Census. It will show the number of moves between pairs of counties, with tabulations provided by age, sex, and race and Hispanic origin.
Thursday, November 17, 2011
A Profile of Canadian Exporters, 1996 to 2009
This issue [PDF] presents statistics, derived from the Exporter Register Database, on exporting establishments for the years 1996 to 2009. It continues to provide information on the number of Canadian exporters and the value of their domestic exports by industry (North American Industry Classification System–NAICS), exporter size, province of residence, countries of destination, and employment size (2009 only).
Noteworthy: "The number of Canadian establishments exporting to countries other than the United States rose," and "the value of exports to the United States fell to
$246.0 billion, a 29.1% decrease from its peak level in 2008 and its lowest value in more than a decade."
Noteworthy: "The number of Canadian establishments exporting to countries other than the United States rose," and "the value of exports to the United States fell to
$246.0 billion, a 29.1% decrease from its peak level in 2008 and its lowest value in more than a decade."
Wednesday, November 16, 2011
County-to-county migration
IRS county-to-county migration data is derived from matched tax returns (one year to the next) and gives very detailed information on the origin and destination of DOMESTIC migration.
Exploring the Digital Nation: Computer and Internet Use at Home
Source: U.S. Department of Commerce
From the Economics and Statistics Administration blog:
The Economics and Statistics Administration (ESA) and the National Telecommunications and Information Administration (NTIA) released a report entitled "Exploring the Digital Nation: Computer and Internet Use at Home." This report investigates broadband Internet use in the United States and finds that disparities continue to exist in broadband Internet adoption among demographic and geographic groups. The report also delves into the reasons why households have not adopted broadband Internet, an important input into the design of policies to achieve a more digitally connected nation.
Full Report [PDF]
From the Economics and Statistics Administration blog:
The Economics and Statistics Administration (ESA) and the National Telecommunications and Information Administration (NTIA) released a report entitled "Exploring the Digital Nation: Computer and Internet Use at Home." This report investigates broadband Internet use in the United States and finds that disparities continue to exist in broadband Internet adoption among demographic and geographic groups. The report also delves into the reasons why households have not adopted broadband Internet, an important input into the design of policies to achieve a more digitally connected nation.
Full Report [PDF]
Tuesday, November 15, 2011
The World Population at 7 Billion
The world’s population will shortly reach 7 billion. The United Nations estimates the world reached this milestone on October 31, 2011. The U.S. Census Bureau estimates the world population will pass 7 billion on March 12, 2012.
More HERE.
More HERE.
2010-2011 Annual Statistical Report of New York State Tax Collections
Statistical Summaries and Historical Tables
This publication contains a series of statistical tabulations detailing taxes administered by the New York State Department of Taxation and Finance. The information presented includes revenues and selected tax structure information for the State's major taxes. It also presents data for some locally imposed taxes.
This edition presents information for New York State Fiscal Year 2010-2011 (SFY 2010-2011) and some historical statistics. New York State's fiscal year is April 1 - March 31.
This publication contains a series of statistical tabulations detailing taxes administered by the New York State Department of Taxation and Finance. The information presented includes revenues and selected tax structure information for the State's major taxes. It also presents data for some locally imposed taxes.
This edition presents information for New York State Fiscal Year 2010-2011 (SFY 2010-2011) and some historical statistics. New York State's fiscal year is April 1 - March 31.
Monday, November 14, 2011
25 Facts You Should Share During National Distance Learning Week
National Distance Learning Week spans the second week of November, and considering the ever-increasing popularity of online colleges and classes, the holiday certainly doesn’t lack compelling content to share. Although it’s not yet a perfect system, Internet-based and other distance learning strategies remain an integral component of secondary and tertiary education these days.
More HERE.
More HERE.
Profiles on Legal Permanent Residents
From the Department of Homeland Security
Legal permanent residents (LPRs) are foreign nationals who have been granted the right to reside permanently in the United States. LPRs are often referred to simply as "immigrants," but they are also known as "permanent resident aliens" and "green card holders."
Profiles of selected demographic characteristics of immigrants who became legal permanent residents during the fiscal year are available by country of birth, state of residence, and metropolitan area of residence.
In FY 2010, of the 1,042,625 persons obtaining legal permanent resident status, 471,849 were men, and 570,771 were women. 476,049 were new arrivals, which means they went to their consulates out of country (214,214 men; 261,833 women). 566,576
were "adjustments of status", meaning they were in the US under a student visa, temporary work visa or other provision (257,635 men; 308,938 women).
Legal permanent residents (LPRs) are foreign nationals who have been granted the right to reside permanently in the United States. LPRs are often referred to simply as "immigrants," but they are also known as "permanent resident aliens" and "green card holders."
Profiles of selected demographic characteristics of immigrants who became legal permanent residents during the fiscal year are available by country of birth, state of residence, and metropolitan area of residence.
In FY 2010, of the 1,042,625 persons obtaining legal permanent resident status, 471,849 were men, and 570,771 were women. 476,049 were new arrivals, which means they went to their consulates out of country (214,214 men; 261,833 women). 566,576
were "adjustments of status", meaning they were in the US under a student visa, temporary work visa or other provision (257,635 men; 308,938 women).
Sunday, November 13, 2011
Moving to U.S. and Amassing a Fortune, No English Needed
By KIRK SEMPLE
More than 40 years after arriving in New York from Mexico uneducated and broke, Felix Sanchez de la Vega Guzman still can barely speak English. Ask him a question, and he will respond with a few halting phrases and an apologetic smile before shifting back to the comfort of Spanish.
Yet Mr. Sanchez has lived the great American success story. He turned a business selling tortillas on the street into a $19 million food manufacturing empire that threaded together the Mexican diaspora from coast to coast and reached back into Mexico itself.
Mr. Sanchez is part of a small class of immigrants who arrived in the United States with nothing and, despite speaking little or no English, became remarkably prosperous. And while generations of immigrants have thrived despite language barriers, technology, these days, has made it easier for such entrepreneurs to attain considerable affluence.
Many have rooted their businesses in big cities with immigrant populations large enough to insulate them from everyday situations that demand English. After gaining traction in their own communities, they have used the tools of modern communication, transportation and commerce to tap far-flung resources and exploit markets in similar enclaves around the country and the world.
More HERE.
More than 40 years after arriving in New York from Mexico uneducated and broke, Felix Sanchez de la Vega Guzman still can barely speak English. Ask him a question, and he will respond with a few halting phrases and an apologetic smile before shifting back to the comfort of Spanish.
Yet Mr. Sanchez has lived the great American success story. He turned a business selling tortillas on the street into a $19 million food manufacturing empire that threaded together the Mexican diaspora from coast to coast and reached back into Mexico itself.
Mr. Sanchez is part of a small class of immigrants who arrived in the United States with nothing and, despite speaking little or no English, became remarkably prosperous. And while generations of immigrants have thrived despite language barriers, technology, these days, has made it easier for such entrepreneurs to attain considerable affluence.
Many have rooted their businesses in big cities with immigrant populations large enough to insulate them from everyday situations that demand English. After gaining traction in their own communities, they have used the tools of modern communication, transportation and commerce to tap far-flung resources and exploit markets in similar enclaves around the country and the world.
More HERE.
The Rising Age Gap in Economic Well-being
Source: Pew Research Center [PDF]
Households headed by older adults have made dramatic gains relative to those headed by younger adults in their economic well-being over the past quarter of a century, according to a new Pew Research Center analysis of a wide array of government data. In 2009, households headed by adults ages 65 and older possessed 42% more median net worth (assets minus debt) than households headed by their same-aged counterparts had in 1984. During this same period, households headed by adults younger than 35 had 68% less wealth than households of their same-aged counterparts had.
Households headed by older adults have made dramatic gains relative to those headed by younger adults in their economic well-being over the past quarter of a century, according to a new Pew Research Center analysis of a wide array of government data. In 2009, households headed by adults ages 65 and older possessed 42% more median net worth (assets minus debt) than households headed by their same-aged counterparts had in 1984. During this same period, households headed by adults younger than 35 had 68% less wealth than households of their same-aged counterparts had.
Saturday, November 12, 2011
Government Counting Sheep? Now, Only in Its Dreams
By WILLIAM NEUMAN
Last year, Wisconsin led the nation in mink farming, producing 833,430 pelts. Texas was the undisputed king of pansies, growing 1.8 million flats of the flowers. And no state harvested more hops than Washington, with 24,336 acres.
This year? Who knows? The government has stopped counting.
Forced to cut its budget, the Agriculture Department has decided to eliminate dozens of reports, including the annual goat census (current population: three million), and the number of catfish on the nation’s fish farms (177 million, not counting the small fry).
Which raises an existential question: If the government stops counting catfish, do catfish farmers no longer count?
...
The decision, announced last month, to stop measuring various categories of agricultural products reflects a cold-blooded assessment of the economic usefulness of the 500 or so reports that the National Agriculture Statistics Service does every year. Corn, soybeans, cotton and other major commodities vital to the national economy will still be weighed, inventoried and otherwise tallied down to the last acre, bushel or bale. The same is true for cattle, pigs and poultry.
But the Agriculture Department is saying, in effect, that the nation can get by just fine, thank you, without knowing how much hops brewers are holding in storage (46 million pounds in September) or the value of honey sold by North Dakota beekeepers ($70 million in 2010).
Farmers say such data is crucial — and not just because it helps them decide how much to plant or how many animals to raise. Potato farmers use reports on potato stocks to decide when to sell. Hops farmers use the data to persuade bankers to lend them money for costly processing facilities. Restaurant chains watch catfish numbers to anticipate price changes. With the Texas drought forcing farmers to send their sheep herds to other states, wool and lamb buyers would normally use federal data to see where the animals went.
The government began producing regular crop reports in 1863, the year after Lincoln created the Agriculture Department. One of the reports being eliminated, an annual sheep inventory (5.5 million head on Jan. 1), can trace its roots at least as far back as 1866. Also ending are reports on bees, honey production, flowers and nursery crops.
The statistics service said it was forced to reduce the frequency of some reports and eliminate others because its budget was cut for the fiscal year that ended in September and it expects further cuts for the current year. The eliminated reports will save $11 million a year.
...
More HERE.
Last year, Wisconsin led the nation in mink farming, producing 833,430 pelts. Texas was the undisputed king of pansies, growing 1.8 million flats of the flowers. And no state harvested more hops than Washington, with 24,336 acres.
This year? Who knows? The government has stopped counting.
Forced to cut its budget, the Agriculture Department has decided to eliminate dozens of reports, including the annual goat census (current population: three million), and the number of catfish on the nation’s fish farms (177 million, not counting the small fry).
Which raises an existential question: If the government stops counting catfish, do catfish farmers no longer count?
...
The decision, announced last month, to stop measuring various categories of agricultural products reflects a cold-blooded assessment of the economic usefulness of the 500 or so reports that the National Agriculture Statistics Service does every year. Corn, soybeans, cotton and other major commodities vital to the national economy will still be weighed, inventoried and otherwise tallied down to the last acre, bushel or bale. The same is true for cattle, pigs and poultry.
But the Agriculture Department is saying, in effect, that the nation can get by just fine, thank you, without knowing how much hops brewers are holding in storage (46 million pounds in September) or the value of honey sold by North Dakota beekeepers ($70 million in 2010).
Farmers say such data is crucial — and not just because it helps them decide how much to plant or how many animals to raise. Potato farmers use reports on potato stocks to decide when to sell. Hops farmers use the data to persuade bankers to lend them money for costly processing facilities. Restaurant chains watch catfish numbers to anticipate price changes. With the Texas drought forcing farmers to send their sheep herds to other states, wool and lamb buyers would normally use federal data to see where the animals went.
The government began producing regular crop reports in 1863, the year after Lincoln created the Agriculture Department. One of the reports being eliminated, an annual sheep inventory (5.5 million head on Jan. 1), can trace its roots at least as far back as 1866. Also ending are reports on bees, honey production, flowers and nursery crops.
The statistics service said it was forced to reduce the frequency of some reports and eliminate others because its budget was cut for the fiscal year that ended in September and it expects further cuts for the current year. The eliminated reports will save $11 million a year.
...
More HERE.
To summarize (Census)
One of my colleagues was doing a presentation about various free data sources. This is what was written about the Census:
The Census Bureau conducts a number of programs. The most famous is the decennial Census, mandated in Article 1 Section 2 of the U.S. Constitution. The 2010 Census had only handful of question pertaining to race, Hispanic origin, gender, age, and whether the address is one’s primary residence.
Census 2000 was the last iteration to contain a long form for approximately 1 household in 6 to fill out. That information included data about income, education, mobility, nativity,, ancestry, disability, military service, housing stock and more. These types of data are now being captured in something called the American Community Survey, which, starting in 2010, will be released every year for all geographies. Because the sample size is smaller than the Census 2000 long form sample, there are data releases for periods of 1-, 3- or 5-year groupings, depending on the size of geographies. There are reasoning behind these breakdowns, but suffice to say here that one ought not ever compare 1-year data with 3-year or 5-year data.
There is also an Economic Census, measuring the country’s businesses every five years, reflecting those years ending with 2 and 7. Since the survey isn’t sent out until the very end of the target years, data for these years released don’t start coming out until a couple years after the named years. Incidentally, there are separate surveys for agriculture and governments conducted at the same time.
If you go to Census.gov, you’ll see headings such as People & Households and Business & Industry in the center of the page. Although not immediately obvious, these terms are hyperlinks that may provide you with easier access to Census data.
The Census Bureau conducts a number of programs. The most famous is the decennial Census, mandated in Article 1 Section 2 of the U.S. Constitution. The 2010 Census had only handful of question pertaining to race, Hispanic origin, gender, age, and whether the address is one’s primary residence.
Census 2000 was the last iteration to contain a long form for approximately 1 household in 6 to fill out. That information included data about income, education, mobility, nativity,, ancestry, disability, military service, housing stock and more. These types of data are now being captured in something called the American Community Survey, which, starting in 2010, will be released every year for all geographies. Because the sample size is smaller than the Census 2000 long form sample, there are data releases for periods of 1-, 3- or 5-year groupings, depending on the size of geographies. There are reasoning behind these breakdowns, but suffice to say here that one ought not ever compare 1-year data with 3-year or 5-year data.
There is also an Economic Census, measuring the country’s businesses every five years, reflecting those years ending with 2 and 7. Since the survey isn’t sent out until the very end of the target years, data for these years released don’t start coming out until a couple years after the named years. Incidentally, there are separate surveys for agriculture and governments conducted at the same time.
If you go to Census.gov, you’ll see headings such as People & Households and Business & Industry in the center of the page. Although not immediately obvious, these terms are hyperlinks that may provide you with easier access to Census data.
Friday, November 11, 2011
An AFF2 how-to guide
With the Legacy American FactFinder ending by the end of 2011, you may find this how-to guide from Michigan’s Dept of Technology helpful.
Thursday, November 10, 2011
Half of First-Time Mothers Receive Paid Leave
Fifty-one percent of working women who had their first birth between 2006 and 2008 received paid leave (i.e. maternity leave, sick leave, vacation) compared with 42 percent between 1996 and 2000, according to a report released by the U.S. Census Bureau.
This finding comes from Maternity Leave and Employment Patterns of First-Time Mothers: 1961-2008 [PDF], a report that analyzes trends in women’s work experience before their first child, identifies their maternity leave arrangements before and after the birth and examines how rapidly they returned to work...
The likelihood that a mother has access to paid leave varies with age, hours worked and education. About 24 percent of women under age 22 used paid leave compared with 61 percent of women 25 and older. Full-time workers were more likely to use paid-leave benefits than part-time workers (56 percent and 21 percent, respectively). Women who have not graduated from high school are less likely to use paid maternity leave as women who have graduated from college.
Other highlights:
Women are more likely to work while pregnant than they did in the 1960s. Two-thirds (66 percent) of women who had their first birth between 2006 and 2008 worked during pregnancy, compared with 44 percent who had their first birth between 1961 and 1965.
Eight out of 10 (82 percent) working women who had their first birth between 2006 and 2008 worked within one month of their child’s birth compared with 73 percent of working women who gave birth to their first child between 1991 and 1995.
Older mothers are more likely than younger mothers to work closer to the end of their pregnancies. Sixty-seven percent of mothers 22 and older worked into the last month of their pregnancy, compared with 56 percent of mothers less than age 22.
Four out of 10 (42 percent) women received unpaid maternity leave. Both paid and unpaid maternity leave were more likely to be used after birth than before.
Twenty-two percent of first time mothers quit their jobs – 16 percent while they were pregnant and another 6 percent by 12 weeks after their child’s birth.
Women who worked during their pregnancy are more likely to return to work within three to five months compared with women who did not work before the birth of their first child.
Eight out of 10 mothers who worked during their pregnancy returned to work within a year of their child’s birth to the same employer. About seven out of 10 of these women returned to a job at the same pay, skill level and hours worked per week.
Two out of 10 mothers switched employers when returning to work. These mothers experienced greater job changes compared with mothers who returned to the same employer. One out of four was employed at a new job that had comparable pay, skill level and hours worked.
This finding comes from Maternity Leave and Employment Patterns of First-Time Mothers: 1961-2008 [PDF], a report that analyzes trends in women’s work experience before their first child, identifies their maternity leave arrangements before and after the birth and examines how rapidly they returned to work...
The likelihood that a mother has access to paid leave varies with age, hours worked and education. About 24 percent of women under age 22 used paid leave compared with 61 percent of women 25 and older. Full-time workers were more likely to use paid-leave benefits than part-time workers (56 percent and 21 percent, respectively). Women who have not graduated from high school are less likely to use paid maternity leave as women who have graduated from college.
Other highlights:
Women are more likely to work while pregnant than they did in the 1960s. Two-thirds (66 percent) of women who had their first birth between 2006 and 2008 worked during pregnancy, compared with 44 percent who had their first birth between 1961 and 1965.
Eight out of 10 (82 percent) working women who had their first birth between 2006 and 2008 worked within one month of their child’s birth compared with 73 percent of working women who gave birth to their first child between 1991 and 1995.
Older mothers are more likely than younger mothers to work closer to the end of their pregnancies. Sixty-seven percent of mothers 22 and older worked into the last month of their pregnancy, compared with 56 percent of mothers less than age 22.
Four out of 10 (42 percent) women received unpaid maternity leave. Both paid and unpaid maternity leave were more likely to be used after birth than before.
Twenty-two percent of first time mothers quit their jobs – 16 percent while they were pregnant and another 6 percent by 12 weeks after their child’s birth.
Women who worked during their pregnancy are more likely to return to work within three to five months compared with women who did not work before the birth of their first child.
Eight out of 10 mothers who worked during their pregnancy returned to work within a year of their child’s birth to the same employer. About seven out of 10 of these women returned to a job at the same pay, skill level and hours worked per week.
Two out of 10 mothers switched employers when returning to work. These mothers experienced greater job changes compared with mothers who returned to the same employer. One out of four was employed at a new job that had comparable pay, skill level and hours worked.
The Research Supplemental Poverty Measure: 2010
The Census Bureau, with assistance from the Bureau of Labor Statistics and in consultation with other appropriate agencies and outside experts, introduces a new measure of poverty to complement the official measure, which has been in use since the 1960s. The official measure will continue to be produced every year and be used to assess eligibility for government programs and determine funding distribution. The supplemental poverty measure, on the other hand, is intended to better reflect contemporary social and economic realities and government policy effects and thus provide a further understanding of economic conditions and trends. This report [PDF] presents estimates of the prevalence of poverty at the national level in 2010 -- overall and for selected demographic groups -- for both the official and supplemental measures.
Wednesday, November 9, 2011
Your Economy
Explore economic activity in your own community - and across the country.
YourEconomy.org is a business census containing more than 24 million active establishments (over 41 million total) providing detailed information about the performance of businesses from a local to a national perspective.
YourEconomy.org is a business census containing more than 24 million active establishments (over 41 million total) providing detailed information about the performance of businesses from a local to a national perspective.
Tuesday, November 8, 2011
Video game sales
One of my colleagues spent a while looking for a source that identified unit sales for the various “Guitar Hero” and “Rock Band” games. Finally, he found this:
www.vgchartz.com.
The “Sales” tab is particularly cool, in that you can enter a title & get unit sales for worldwide & the U.S.
www.vgchartz.com.
The “Sales” tab is particularly cool, in that you can enter a title & get unit sales for worldwide & the U.S.
Monday, November 7, 2011
China Agricultural and Economic Data
Where to find data for Chinese agriculture? The US Dept of Agriculture!
The national level database contains 250 annual series, including crop and livestock production, input use, macroeconomic data, industrial output, price indexes, and food consumption.
The national level database contains 250 annual series, including crop and livestock production, input use, macroeconomic data, industrial output, price indexes, and food consumption.
Sunday, November 6, 2011
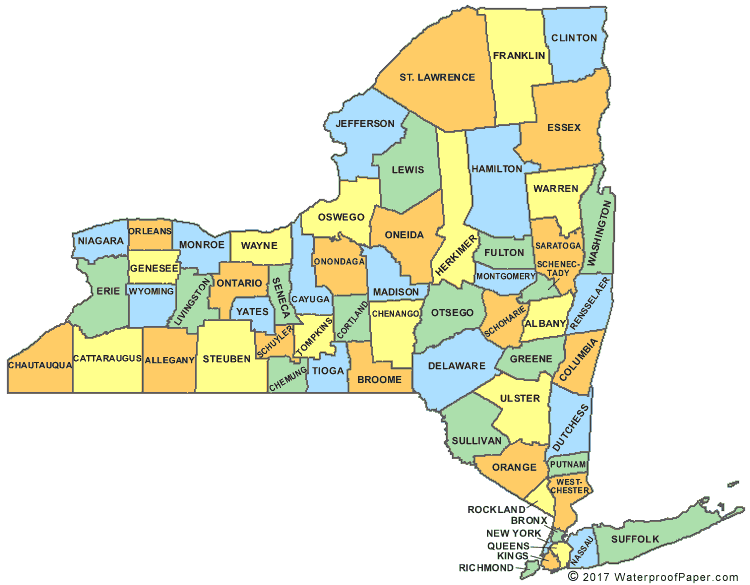
Saturday, November 5, 2011
The New NHGIS
The Minnesota Population Center is pleased to announce the release of the new National Historical Geographic Information System (NHGIS) website, including:
A redesigned front page providing access to new FAQs, user guides and data documentation
A redesigned data extract system that allows users to:
download multiple years of data in one extract
download multiple geographic levels (states, counties, etc.) in one extract
constrain or expand data searches flexibly by specifying any combination of geographic levels, years, topics, or datasets
The new site also provides Census 2010 Redistricting Data with corresponding 2010 shapefiles. More new data from the American Community Survey and 2010 Summary File 1 will be added throughout the year.
Explore the new site now!
Please note: the original NHGIS website remains accessible, but will be taken offline later this fall, after which users will no longer be able to access previously requested extracts. If you still need to download some requested data or would like to revise or resubmit older extracts through the original site, please do so in the near future.
A redesigned front page providing access to new FAQs, user guides and data documentation
A redesigned data extract system that allows users to:
download multiple years of data in one extract
download multiple geographic levels (states, counties, etc.) in one extract
constrain or expand data searches flexibly by specifying any combination of geographic levels, years, topics, or datasets
The new site also provides Census 2010 Redistricting Data with corresponding 2010 shapefiles. More new data from the American Community Survey and 2010 Summary File 1 will be added throughout the year.
Explore the new site now!
Please note: the original NHGIS website remains accessible, but will be taken offline later this fall, after which users will no longer be able to access previously requested extracts. If you still need to download some requested data or would like to revise or resubmit older extracts through the original site, please do so in the near future.
Friday, November 4, 2011
More Young Adults are Living in Their Parents' Home
Between 2005 and 2011, the proportion of young adults living in their parents' home increased, according to the U.S. Census Bureau. The percentage of men age 25 to 34 living in the home of their parents rose from 14 percent in 2005 to 19 percent in 2011 and from 8 percent to 10 percent over the period for women.
These statistics come from http://www.census.gov/population/www/socdemo/hh-fam.html America's Families and Living Arrangements: 2011, a series of tables from the 2011 Current Population Survey providing a look at the socioeconomic characteristics of families and households at the national level.
These statistics come from http://www.census.gov/population/www/socdemo/hh-fam.html America's Families and Living Arrangements: 2011, a series of tables from the 2011 Current Population Survey providing a look at the socioeconomic characteristics of families and households at the national level.
Thursday, November 3, 2011
Every Secretary of State office in the US
Here's a link to a directory of all 50 states' Secretary of State sites, where one incorporates.
Wednesday, November 2, 2011
State & County QuickFacts and USA Counties
State & County QuickFacts provides "Quick, easy access to facts about people, business, and geography".
USA Counties features over 6,300 data items for the United States, States and counties from a variety of sources. Files include data published for 2010 population as well as many other items from the 2010 Census of Population and Housing, the 1990 census, the 1980 census and the 2007, 2002, 1997, and 1992 economic censuses.
Both from the US Census.
USA Counties features over 6,300 data items for the United States, States and counties from a variety of sources. Files include data published for 2010 population as well as many other items from the 2010 Census of Population and Housing, the 1990 census, the 1980 census and the 2007, 2002, 1997, and 1992 economic censuses.
Both from the US Census.
Tuesday, November 1, 2011
7 Billion: How Did We Get So Big So Fast?
From NPR:
It was just over two centuries ago that the global population was 1 billion — in 1804. But better medicine and improved agriculture resulted in higher life expectancy for children, dramatically increasing the world population, especially in the West.
As higher standards of living and better health care are reaching more parts of the world, the rates of fertility — and population growth — have started to slow down, though the population will continue to grow for the foreseeable future.
U.N. forecasts suggest the world population could hit a peak of 10.1 billion by 2100 before beginning to decline. But exact numbers are hard to come by — just small variations in fertility rates could mean a population of 15 billion by the end of the century.
It was just over two centuries ago that the global population was 1 billion — in 1804. But better medicine and improved agriculture resulted in higher life expectancy for children, dramatically increasing the world population, especially in the West.
As higher standards of living and better health care are reaching more parts of the world, the rates of fertility — and population growth — have started to slow down, though the population will continue to grow for the foreseeable future.
U.N. forecasts suggest the world population could hit a peak of 10.1 billion by 2100 before beginning to decline. But exact numbers are hard to come by — just small variations in fertility rates could mean a population of 15 billion by the end of the century.
New Birth, Death, and Employment Firm Size Data
U.S. Census Bureau annual employment size of firm data (partially funded by the SBA Office of Advocacy) on firm births, deaths and job creation has been updated for 2008. Nonemployer data for 2009 was also updated and saw a decline from 2008 levels. See HERE for data.
Should you need further information, please feel free to contact the Office of Advocacy at (202) 205-6533 or advocacy@sba.gov.
Should you need further information, please feel free to contact the Office of Advocacy at (202) 205-6533 or advocacy@sba.gov.
Subscribe to:
Posts (Atom)