Showing posts with label American Community Survey. Show all posts

Friday, December 8, 2017

Commuting, Median Rents and Language Other Than English

New American Community Survey Statistics Provide Local Data for Every Community Nationwide
English
DEC. 7, 2017 — The nation experienced an increase in commuting times and median gross rent along with a rise in English proficiency among those who spoke another language. These are only a few of the statistics released today from the U.S. Census Bureau’s 2012-2016 American Community Survey five-year estimates, which features more than 40 social, economic, housing and demographic topics, including homeowner rates and costs, health insurance and educational attainment.
“The American Community Survey allows us to track incremental changes across our nation on how people live and work, year-to-year,” said David Waddington, chief of the Social, Economic, and Housing Statistics Division. “It’s our country’s only source of small area estimates for socio-economic and demographic characteristics. These estimates help people, businesses and governments throughout the country better understand the needs of their populations, the markets in which they operate and the challenges and opportunities they face.”
The survey produces statistics for all of the nation’s 3,142 counties. In addition, it is the only full dataset available for three-fourths of all counties with populations too small to produce a complete set of single-year statistics (2,322 counties). Each year, Census Bureau data helps determine how more than $675 billion of federal funding are spent on infrastructure and services, from highways to schools to hospitals.
Data Highlights
The following highlights are from the 2012-2016 American Community Survey five-year estimates release, unless otherwise noted.
Commuting Characteristics
Between 2012 and 2016, the average commute time for the nation was 26.1 minutes, an increase of 0.7 minutes from 25.4 minutes in the 2007-2011 American Community Survey five-year estimates data.
·       The longest average one-way travel times are generally associated with larger metro areas or smaller metro areas within commuting distance of a larger metro area. Among the longest were:
o   East Stroudsburg, Pa., metropolitan area (38.6 minutes).
o   New York-Newark-Jersey City, N.Y.-N.J.-Pa., metropolitan area (35.9 minutes).
o   Washington-Arlington-Alexandria, D.C-Va.-Md.-W.V., metropolitan area (34.4 minutes).
·       The shortest average one-way travel times are usually associated with smaller metro areas. Among the shortest were:
o   Walla Walla, Wash., metropolitan area (15.4 minutes).
o   Grand Forks, N.D.-Minn., metropolitan area (15.5 minutes).
o   Great Falls, Mont., metropolitan area (15.6 minutes).
The travel times for Walla Walla, Grand Forks and Great Falls metro areas are not statistically different from each other.
·       About 7.5 million workers (5.1 percent) commute by bus, subway, commuter rail, light rail or some other form of public transportation on a typical workday. Public transportation usage is highly concentrated within the nation’s large metro areas.
·       Among metro areas with high rates of public transportation commuting:
o    The New York-Northern New Jersey-Long Island, N.Y.-N.J.-Pa., metropolitan area stands out with 31.0 percent of workers (2,918,906 people) commuting by transit.
o    The San Francisco-Oakland-Hayward, Calif., metropolitan area and the Washington-Arlington-Alexandria, D.C.-Va.-Md.-W.V., metropolitan area are at 16.5 percent (369,759 people) and 14.0 percent (443,870 people), respectively.
·       County-level commuting data are available here.
Language Spoken at Home and English-Speaking Ability
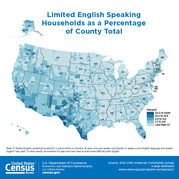
Between 2012 and 2016, 21.1 percent (63,172,059) of the population age 5 and older spoke a language other than English at home, an increase from 20.3 percent in the 2007-2011 American Community Survey five-year estimates data.
·       Of those who spoke a language other than English at home, 59.7 percent (37,731,103) also spoke English “very well.” This proportion increased from 57.1 percent in 2007-2011.
·       New data for five languages are available on American Fact Finder Table B16001: Haitian, Punjabi, Bengali, Telugu and Tamil.
o   There were 806,254 people ages 5 and older who spoke Haitian at home. Almost half (48.8 percent) lived in Florida.
o   Of the 280,867 people ages 5 and older who spoke Punjabi at home, 48.0 percent lived in California.
o   Of the 259,204 people ages 5 and older who spoke Bengali at home, 38.6 percent lived in New York.
o   The 321,695 people ages 5 and older who spoke Telugu at home and the 238,699 people speaking Tamil at home were more evenly distributed across many parts of the nation. For both languages, the highest concentration of speakers lived in California, followed by Texas and New Jersey (the number of persons who spoke Tamil in Texas and New Jersey are not statistically different).
Median Gross Rent
The United States experienced a $21 increase in median gross rent — from $928 in 2007-2011 (adjusted for inflation), to $949 in 2012-2016.
·       The 50 most populous metropolitan areas had increases in median gross rent that outnumbered decreases four to one. There were 32 increases, eight decreases and nine that had no change from 2007-2011 data. (Comparisons for the Los Angeles-Long Beach-Anaheim, Calif., metropolitan area cannot be made due to boundary changes.)
·       Of the 551 micropolitan areas, 146 changed, increases outnumbering decreases two to one with 107 increases and 39 decreases.
County-level gross rent data are available here.
Income
·       Of the 3,142 counties in the United States, 563 counties (17.9 percent) experienced a decline in median household income, while median household income increased in 234 counties (7.4 percent).
·       Among the more than 29,000 places in the United States, 3,254 places (11.1 percent) experienced a decline in median household income, while 926 places (3.2 percent) experienced income growth.
·       For the period of 2012 to 2016, the locations with the highest and lowest median household incomes were:
o   By county and county equivalent:
·        Loudon County, Va., Falls Church City, Va., Fairfax County, Va., Howard County, Md., and Arlington County, Va., were among the highest.
·        McCreary County, Ky., Sumter County, Ala., Holmes County, Miss., Stewart County, Ga., and Lee County, Ky., were among the lowest.
o    By metropolitan statistical area:
·        San Jose-Sunnyvale-Santa Clara, Calif., Washington-Arlington-Alexandria, D.C.-Va.-Md.-W.V., California-Lexington Park, Md., Bridgeport-Stamford-Norwalk, Conn., and San Francisco-Oakland-Hayward, Calif., metropolitan statistical areas were among the highest.
·        Brownsville-Harlingen, Texas, Sebring, Fla., McAllen-Edinburg-Mission, Texas, Pine Bluff, Ark., and Valdosta, Ga., metropolitan statistical areas were among the lowest.
o    By micropolitan statistical area:
·        Los Alamos, N.M., Summit Park, Utah, Williston, N.D., Juneau, Alaska, and Gillette, Wyo., micropolitan statistical areas were among the highest.
·        Middlesborough, Ky., Rio Grande City, Texas, Helena-West Helena, Ark., Las Vegas, N.M., and Indianola, Miss., micropolitan statistical areas were among the lowest.
Poverty
·       Of the 3,142 counties across the nation, 167 counties (5.3 percent) experienced a decline in poverty rates, while 566 counties (18.0 percent) showed a rate increase.
·       Looking at the more than 29,000 places in the United States, 1,391 places (4.7 percent) experienced a decline in poverty rates, while 2,927 places (10.0 percent) had their poverty rates increase.
·       From 2012 to 2016, among geographic areas with 10,000 people or more:
o   By county and county equivalent:
·        Falls Church City, Va., and Lincoln County, S.D., had among the lowest poverty rates for counties and county equivalents.
·        Oglala Lakota County and Todd County in South Dakota, Holmes County, Miss., and McCreary County, Ky., had among the highest poverty rates.
o   By metropolitan statistical area:
·        Among all metropolitan areas, Fairbanks, Alaska, California-Lexington Park, Md., Midland, Texas, and Barnstable Town, Mass., had among the lowest poverty rates.
·        Brownsville-Harlingen, McAllen-Edinburg-Mission and Laredo, Texas, had among the highest poverty rates.
o   By micropolitan areas:
·        Los Alamos, N.M., McPherson, Kan., and Dickinson, N.D., were among those with lower poverty rates.
·        aGallup, N.M., Cleveland, Miss., and Rio Grande City and Raymondville, Texas, were among those with higher poverty rates.
Also Released from the American Community Survey:
·       The five-year estimates feature “Comparison Profile” tables. These tables compare differences between the latest set of American Community Survey five-year estimates (2012-2016) and the most recent, nonoverlapping five-year estimates (2007-2011). The tables note statistically significant differences.
·       The Application Programming Interface updated with 2012-2016 American Community Survey five-year estimates statistics.
·       Guidance on making comparisons is available on our website.
New Data Exploration Platform with County-Level Geography Profiles
The U.S. Census Bureau is currently working to streamline online data dissemination to be more customer-driven and user-friendly by creating one centralized and standardized platform to underlie the search on census.gov. In addition to being available through the American FactFinder, some of the 2012-2016 American Community Survey five-year estimates will be released through the new platform, which is currently a preview site at data.census.gov. Specific products available include detailed tables, data profiles, subject tables and comparison profiles.
New for this release, data.census.gov is featuring county-level geography profiles, which provide data users a high-level overview of each of the 3,144 counties in a visual format with maps, charts and graphs. These profiles include 2012-2016 American Community Survey five-year estimates data on a variety of topics including income, commuting, home ownership and veterans, as well as business and industry data from the 2012 Economic Census, 2012 County Business Patterns and 2015 Survey of Business Owners.
We encourage you to take a look at data.census.gov and provide your thoughts on our work in progress at cedsci.feedback@census.gov. 
About the American Community Survey
The American Community Survey is the only source of small area statistics for social, economic, housing and demographic characteristics. It gives communities the current information they need to plan investments and services. Retailers, homebuilders, police departments, and town and city planners are among the many private- and public-sector decision-makers who count on these annual results. Visit the Stats in Action Videos page to see examples. These statistics would not be possible without the participation of the randomly selected households in the survey.
Because it is a survey based on a sample of the population rather than the entire population, the American Community Survey produces estimates. To aid data users, the Census Bureau calculates and publishes a margin of error for every estimate. For guidance on making comparisons, please visit census.gov.
Citation Guidance
When sourcing this data, please use “2012-2016 American Community Survey 5-year estimates.”

Tuesday, March 1, 2016

Women’s Earnings by Occupation from the 2014 American Community Survey

The U.S. Census Bureau released today a new table showing median earnings by detailed occupation from the 2014 American Community Survey. The table shows ratios indicating the percentage of women in an occupation, as well as the male-to-female earnings ratio in the occupation for full-time, year-round workers in the past 12 months. Internet address: http://www.census.gov/people/io/publications/table_packages.html.

Wednesday, December 2, 2015

The Growth of "American" as an Ancestral Choice in the ACS

It is interesting to see how the Herkimer/Oneida County response to the question of ancestry has changed over time when looking at those that identified as having a single ancestry - "American". While the area used to be similar to the rest of the state and country, in the last five years it has seen a huge rise regionally in the percent of people who now say that they are simply "American" when asked about their ancestral past.

More from Herkimer and Oneida Counties Census Data Affiliate.

Here are counties with single year ACS data…ordered by % saying AMERICAN…


Madison County, New York 42,638 20,671 48.5%
Chemung County, New York 49,475 16,284 32.9%
Oneida County, New York 134,037 36,384 27.1%
Niagara County, New York 120,241 30,586 25.4%
Steuben County, New York 47,596 11,394 23.9%
Orange County, New York 226,108 48,854 21.6%
Tompkins County, New York 52,753 11,053 21.0%
Oswego County, New York 49,703 9,984 20.1%
Warren County, New York 28,849 4,475 15.5%
Ontario County, New York 50,787 6,216 12.2%
Cattaraugus County, New York 35,854 4,255 11.9%
St. Lawrence County, New York 52,168 5,754 11.0%
Sullivan County, New York 37,400 3,943 10.5%
Broome County, New York 83,176 7,833 9.4%
Albany County, New York 158,430 14,408 9.1%
Chautauqua County, New York 57,055 5,179 9.1%
Saratoga County, New York 93,120 8,007 8.6%
Schenectady County, New York 83,278 7,073 8.5%
Jefferson County, New York 52,942 4,481 8.5%
Cayuga County, New York 34,603 2,674 7.7%
Dutchess County, New York 142,205 9,916 7.0%
Onondaga County, New York 225,269 15,547 6.9%
Rensselaer County, New York 61,427 3,882 6.3%
Rockland County, New York 212,269 13,032 6.1%
Monroe County, New York 406,058 24,249 6.0%
Nassau County, New York 836,135 47,256 5.7%
Suffolk County, New York 850,838 47,395 5.6%
New York County, New York 1,070,770 53,578 5.0%
Kings County, New York 1,955,952 95,355 4.9%
Ulster County, New York 84,629 4,114 4.9%
Westchester County, New York 652,524 31,059 4.8%
Erie County, New York 484,137 19,753 4.1%
Queens County, New York 1,774,242 69,328 3.9%
Richmond County, New York 310,984 9,617 3.1%
Bronx County, New York 1,191,498 19,991 1.7%

Wednesday, August 12, 2015

What We Don’t Know About Canada Might Hurt Us

When Canadian Prime Minister Stephen Harper announced plans in 2010 to make the government’s primary source of household data into a voluntary survey, researchers across Canada warned of dire consequences for the survey’s reliability. Those predictions have largely come true: In 2006, nearly 94 percent of Canadian households that received the survey responded to it. In 2011, the response rate fell below 70 percent. As a result, Statistics Canada, the country’s statistical agency, decided not to release detailed data on Snow Lake, Manitoba and more than 1,000 other communities, and researchers have called into question the validity of the data on other areas that was released.

Canada’s experience with a voluntary household survey is now drawing attention in the United States. Republican lawmakers led by Texas Congressman Ted Poe are pushing to make a similar change to the American Community Survey — a similar, annual questionnaire that aims to measure national trends in dozens of areas such as education, housing, fertility and employment by surveying more than 3 million Americans each year. Both Poe and his Canadian counterparts consider the surveys an invasion of privacy, but researchers on both sides of the border say the Canadian experiment is a harsh lesson in what can happen when a country loses its commitment to collecting accurate information about its residents.

More from fivethirtyeight.com

Sunday, June 7, 2015

New ACS Website Coming Soon

The U.S. Census Bureau plans to launch a newly designed website for the American Community Survey (ACS) on June 23.

The website will have a look and feel and contain terminology consistent with census.gov, allowing users to quickly find information thanks to an easy to understand hierarchical structure. Users may find that previously bookmarked pages must be updated, but we will provide hyperlinks to the most popular content in our announcements.

Monday, April 13, 2015

American Community Survey (ACS) Data Products Survey

The U.S. Census Bureau’s American Community Survey Office (ACSO)  is conducting a survey to gather data user feedback on ACS data products.  The Census Bureau wants to ensure the ACS program continues to produce relevant and timely data products that meet the needs of and are accessible to the public.
You are invited to provide feedback on the content of the ACS data products and usage of geographic areas, the coinciding documentation currently provided on the website, as well as the way in which Census data products are accessed and disseminated.  The Bureau wants to hear from you!

Wednesday, March 11, 2015

Supplemental Nutrition Assistance Program (SNAP) Receipt for Households: 2000-2013

This American Community Survey brief presents statistics on Supplemental Nutrition Assistance Program receipt at the national and state levels based on data from the 2013 American Community Survey. In addition, this report discusses the current SNAP receipt rates for metropolitan statistical areas with large populations. 

Sunday, March 8, 2015

Please take action to save the ACS 3-year data products.

Steven Ruggles
President, Population Association of America
Regents Professor, University of Minnesota
Director, Minnesota Population Center

The U.S. Census Bureau plans to discontinue the 3-year American Community Survey (ACS) data products as a cost-saving maneuver. Although the Census Bureau will continue to provide 1-year and 5-year ACS products, significant data will be lost.

The 3-year data provide a unique combination of spatial, temporal, and statistical precision, enabling a range of high-value analyses that the other ACS products cannot support. With a sample three times larger than 1-year ACS data, 3-year estimates have considerably smaller margins of error and are made available for nearly twice as many areas. Compared to 5-year data, 3-year data provide a degree of specificity that is crucial for some time series comparisons

The 3-year estimates may be used to analyze pre-recession (2005-2007), recession (2008-2010), and post-recession (2011-2013) characteristics of population and housing, summarizing shorter time periods than 5-year data and smaller areas (with at least 20,000 people) than 1-year data (with at least 65,000 people).

If you believe this change would significantly harm the nation's statistical infrastructure, you should make your feelings known by email:

Email James Treat, Chief of the American Community Survey Office, at james.b.treat@census.gov, and tell him how this elimination will negatively impact your research. Please be as specific as possible!

Email Katherine K. Wallman, Chief Statistician of the US Office of Management and Budget (OMB) at Katherine_K._Wallman@omb.eop.gov, and tell her how this cut will negatively impact your research. The OMB must approve the spending plan proposed by the Census Bureau.

For more details on the proposed discontinuation and how it would impact research, please see these posts:

The ACS 3-year Demographic Estimates Are History

Opportunities to Provide Input Regarding the Proposed Elimination of ACS 3-year Data Products

Census to Eliminate 3-year Estimates

If policy-makers, academics, and students explain why these data are important, we may save this critical element of the nation's statistical infrastructure. I urge you to send your comments to james.b.treat@census.gov and Katherine_K_Wallman@omb.eop.gov and copy us at nhgis@umn.edu.

Thank you.

Wednesday, February 4, 2015

Census Bureau planning to discontinue the production of all 3-year ACS data

The Census Bureau is planning to discontinue the production of all 3-year American Community Survey data, according to their budget justification document:

"The Census Bureau proposes to terminate permanently the “3-Year Data” Product. The Census Bureau intended to produce this data product for a few years when the ACS was a new survey. Now that the ACS has collected data for nearly a decade, this product can be discontinued without serious impacts on the availability of the estimates for these communities."

See page 110 of 190, or page CEN-106 of US Census Budget estimates for FY 2016.

The elimination of the 3-yr ACS data products must be approved by OMB before it becomes official.

Monday, December 8, 2014

How Young Adults Today Compare With Previous Generations in Neighborhoods Nationwide

Young adults today, often called the millennial generation, are more likely to be foreign born and speak a language other than English at home, compared with young adults in 1980, according to the U.S. Census Bureau’s latest statistics from the American Community Survey released this week.

“Many of the differences between generations examined within these latest data reflect long-term demographic and societal changes,” said Jonathan Vespa, a Census Bureau demographer. “Three decades of decennial census statistics combined with the latest American Community Survey statistics give us a unique view of how — and where — our nation is changing. In this case, we can look at the changing characteristics of young adults over the last few decades.”

More from the Census Bureau.

Thursday, November 13, 2014

ACS for Local Area Planning and Analysis: The 2014 Planning Database

The 2014 Planning Database of selected 2010 Census and selected 2008-2012 5-year American Community Survey (ACS) estimates is now available, incorporating the most current ACS small area estimates. Data are provided at both the census block group and the tract levels of geography. The Planning Database (PDB) assembles a range of housing, demographic, socioeconomic, and census operational data that can be used for survey and census planning. In addition to variables extracted from the census and ACS databases, operational variables include the 2010 Census Mail Return Rate for each block group and tract.