Wednesday, December 31, 2014

The Manufacturing and International Trade Report

The U.S. Census Bureau has released the 2012 Manufacturing and International Trade Report (MITR). This new annual report contains manufacturing data on the value of product shipments. The data are published on a North American Industry Classification System (NAICS) basis from the 2012 Economic Census Industry Series. The MITR also includes official U.S. export and import merchandise trade statistics.

The MITR will, for the first time, provide a comprehensive comparison between detailed manufacturing product class data and associated import and export data.

Tuesday, December 30, 2014

Population of locations involved in determining the nation’s top team in college football

The U.S. Census Bureau presents a graphic that shows the population of the cities and metropolitan areas involved in the first-ever four-team playoff in college football’s top division. In the first semifinal on Thursday, Jan. 1, No. 2-ranked Oregon (Eugene, Ore.) takes on No. 3 Florida State (Tallahassee, Fla.) in Pasadena, Calif. In the other semifinal, top-ranked Alabama (Tuscaloosa, Ala.) faces No. 4 Ohio State (Columbus, Ohio) in New Orleans. The championship game will be on Monday, Jan. 12 in Arlington, Texas.

Monday, December 29, 2014

Census Bureau Projects U.S. and World Populations on New Year's Day


New Year's Day Population
As the nation prepares to ring in the new year, the U.S. Census Bureau today projected the United States population will be 320,090,857 on Jan. 1, 2015. This represents an increase of 2,334,187, or 0.73 percent, from New Year’s Day 2014, and 11,345,319, or 3.67 percent, since Census Day (April 1) 2010.

Saturday, December 27, 2014

Most decade-specific words in Billboard popular song titles 1890-2014

From prooffreader.com

The inspiration for this post came from my being too lazy to set my iPod to shuffle, and then noticing it played a bunch of songs in a row from the 1930s and '40s that started with the letters "in" ("In the Wee Small Hours of the Morning," "In the Still of the Night", etc.) Naturally, being a data nerd, my first thought was to quantify the phenomenon.

The data comes not from Billboard itself, but from www.bullfrogspond.com; I don't know much about the data source, but it certainly looks thorough and painstaking, and up to date.

Friday, December 26, 2014

Reporters Without Borders' 2014 World Press Freedom Index: U.S. falls 13 places


Reporters Without Borders has posted its annual look at the state of press freedom around the world. As always, there are problems galore. As RWB points out, press freedom is non-existent in many countries, and people brave enough to be reporters there risk their liberty or lives even in absence of war. China, Sudan and Saudi Arabia are among them. On the other end of the study are Canada and the Scandinavian countries, where the press is outstandingly free. As for the United States:
Countries that pride themselves on being democracies and respecting the rule of law have not set an example, far from it. Freedom of information is too often sacrificed to an overly broad and abusive interpretation of national security needs, marking a disturbing retreat from democratic practices. Investigative journalism often suffers as a result.

This has been the case in the United States (46th), which fell 13 places, one of the most significant declines, amid increased efforts to track down whistleblowers and the sources of leaks.

Thursday, December 25, 2014

The 2014 Holiday Season

2014 Holiday Season
This festive season, or simply the holidays, is a time for gathering and celebrating with family and friends, gift giving, reflection and thanks. To commemorate this time of year, the U.S. Census Bureau presents the following holiday-related facts and figures from its collection of statistics. 
Rush to the Stores
$24.4 billion
Estimated retail sales by the nation’s department stores (including leased departments) in December 2013. This represents an estimated 40.9 percent jump from the previous month when retail sales were estimated at 17.3 billion. No other month-to-month increase in department store sales last year was as large. Source: U.S. Census Bureau, Monthly Retail Trade Survey

Wednesday, December 24, 2014

Trashing electronics becomes illegal in New York

If Santa brings you a shiny new laptop, game console or flat-screen TV, don't toss the old one in the trash. Starting Jan. 1, the final phase of New York's 2010 electronics recycling law takes effect, making it illegal for consumers to throw so-called "e-waste" in the garbage. Violators can be fined $100.

Read More at WRBG-TV


Recycling Your Electronic Waste

Disposal Ban: Beginning January 1, 2015, consumers may no longer dispose of certain types of electronic equipment in landfills, waste-to-energy facilities, in the trash, or at curbside for trash pickup. Use the recycling options described below.

Two Ways to Recycle Your Electronic Waste

Option 1: Use a Manufacturer's Takeback Program

  1. Go to DEC's list of electronic equipment manufacturers registered in NYS, to find manufacturers, their brands electronic equipment covered by the law, and their electronic waste acceptance program websites and toll-free telephone numbers.
  2. Follow the specific instructions listed on the manufacturer's website or provided over the telephone. The manufacturer is required to provide information on how to recycle your equipment, free of charge.

Tuesday, December 23, 2014

Florida Passes New York to Become the Nation’s Third Most Populous State

From the Census Bureau:

By adding an average of 803 new residents each day between July 1, 2013 and July 1, 2014, Florida passed New York to become the nation’s third most populous state, according to U.S. Census Bureau state population estimates released today. Florida’s population grew by 293,000 over this period, reaching 19.9 million. The population of New York increased by 51,000 to 19.7 million.
California remained the nation’s most populous state in 2014, with 38.8 million residents, followed by Texas, at 27.0 million. Although the list of the 10 most populous states overall was unchanged, two other states did change positions, as North Carolina moved past Michigan to take the ninth spot.
Another milestone took place in Georgia (ranked 8th), which saw its population surpass 10 million for the first time.
North Dakota was the nation’s fastest-growing state over the last year. Its population increased 2.2 percent, followed by the 1.7 percent growth in Nevada and Texas. Each of the 10 fastest-growing states was in the South or West with the exception of North Dakota. 
Six states lost population between July 1, 2013, and July 1, 2014: Illinois (9,972 or -0.08 percent), West Virginia (3,269 or -0.18 percent), Connecticut (2,664 or -0.07 percent), New Mexico (1,323 or -0.06 percent, Alaska (527 or -0.07 percent) and Vermont (293 or -0.05 percent).
The United States as a whole saw its population increase by 2.4 million to 318.9 million, or 0.75 percent.

Thursday, December 18, 2014

NEW: 2012 Manufacturing and International Trade Report

This new annual report from the U.S. Census Bureau will, for the first time, provide a comprehensive comparison between detailed manufacturing product class data and associated import and export data. The data are published on a North American Industry Classification System basis from the 2012 Economic Census Industry Series, presented with official U.S. export and import merchandise trade statistics. Future reports will also incorporate statistics from the Annual Survey of Manufactures. Go to: http://www.census.gov/foreign-trade/Press-Release/MITR/2012/.

Wednesday, December 17, 2014

How School-Age Child Poverty in Every County Compares with Prerecession Levels


SAIPE
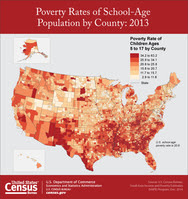
      According to U.S. Census Bureau estimates released today, the poverty rate for school-age children had no statistical change in 2,199 counties between 2007 and 2013 while 928 counties experienced an increase and 15 showed a decline.
      The statistics are from the Small Area Income and Poverty Estimates program, which provides the only up-to-date, single-year income and poverty statistics for all counties and school districts — roughly 3,140 counties and nearly 14,000 school districts nationally. Data from the American Community Survey are an important input to these estimates.
      “County school-age child poverty rates are still above their prerecession levels in metropolitan areas of California, Nevada, Arizona, Florida, Georgia, the Carolinas, as well as the coastal areas of the Northeast and Great Lakes states,” said Wesley Basel of the Census Bureau’s Small Area Estimates Branch. “State and local programs use these statistics for distributing funds and managing school programs.”

Tuesday, December 16, 2014

State and Local Government Spending Grows Faster Than Revenue

Finances
      Between 2007 and 2012, total expenditures for state and local governments increased by 18.2 percent, from $2.7 trillion to $3.2 trillion, while total revenue declined 1.1 percent over the same five-year period, from $3.1 trillion to $3.0 trillion, according to new U.S. Census Bureau data from the 2012 Census of Governments released today.
      Two major contributors to the decline in total revenues were employee retirement revenue, which includes earnings on investments and contributions, (dropping 67.7 percent, from $533.3 billion to $172.0 billion) and interest earnings (falling 44.6 percent, from $91.9 billion to $50.9 billion).
      “State and local government revenues continue to be impacted by capital market fluctuations, especially employee retirement revenues,” said Kevin Deardorff, chief of the Census Bureau’s Economy-Wide Statistics Division.
      The findings are from the 2012 Census of Governments: Finance — Surveys of State and Local Government Finances, which shows revenues, expenditures, debt, and cash and security holdings by level and type of government. Level of government includes state, local, and state and local combined. Type of government includes state, county, city, township, special district and school district.

Monday, December 15, 2014

Trends in Income Inequality and its Impact on Economic Growth

In most OECD countries, the gap between rich and poor is at its highest level in 30 years. Today, the richest 10 per cent of the population in the OECD area earn 9.5 times the income of the poorest 10 per cent; in the 1980s this ratio stood at 7:1 and has been rising continuously ever since. However, the rise in overall income inequality is not (only) about surging top income shares: often, incomes at the bottom grew much slower during the prosperous years and fell during downturns, putting relative (and in some countries, absolute) income poverty on the radar of policy concerns.

More from OECD

Friday, December 12, 2014

U.S. Population Projections: 2014-2060

The Population Projections Program produces projections of the United States resident population by age, sex, race, Hispanic origin, and nativity. The 2014 National Projections are based on the July 1, 2013 population estimates, which are based on the 2010 Census, and provide projections of the population for July 1, 2014 to July 1, 2060. The projections were produced using a cohort-component method and are based on assumptions about future births, deaths, and net international migration.

More from the Census Bureau, which releases new national projections periodically.

Thursday, December 11, 2014

The Census Bureau released 2012 Commodity Flow statistics

The Commodity Flow Survey (CFS), undertaken through a partnership between the Census Bureau and the Bureau of Transportation Statistics (BTS) is conducted every 5 years (years ending in "2" and "7") as part of the Economic Census. The CFS produces data on the movement of goods in the United States. It provides information on commodities shipped, their value, weight, and mode of transportation, as well as the origin and destination of shipments of commodities from manufacturing, mining, wholesale, and selected retail and services establishments.

Please visit the U.S. Census Bureau’s American Fact Finder to access the data. 

Tuesday, December 9, 2014

Nearly 6 Out of 10 Children Participate in Extracurricular Activities

A Child's Day
      Fifty-seven percent of children between 6 and 17 years old participate in at least one after-school extracurricular activity, according to a new report released today from the U.S. Census Bureau. The report found that children were more likely to participate in sports (35 percent) than clubs or lessons like music, dance and language (both around 29 percent).
      A Child’s Day: Living Arrangements, Nativity, and Family Transitions: 2011 uses statistics from the Survey of Income and Program Participation to examine aspects of a child’s well-being, examining their participation in extracurricular activities, and how participation related to a child’s living arrangements, parental nativity status and household or economic transitions. 

Monday, December 8, 2014

How Young Adults Today Compare With Previous Generations in Neighborhoods Nationwide

Young adults today, often called the millennial generation, are more likely to be foreign born and speak a language other than English at home, compared with young adults in 1980, according to the U.S. Census Bureau’s latest statistics from the American Community Survey released this week.

“Many of the differences between generations examined within these latest data reflect long-term demographic and societal changes,” said Jonathan Vespa, a Census Bureau demographer. “Three decades of decennial census statistics combined with the latest American Community Survey statistics give us a unique view of how — and where — our nation is changing. In this case, we can look at the changing characteristics of young adults over the last few decades.”

More from the Census Bureau.

Friday, December 5, 2014

Employer-Reported Workplace Injuries and Illnesses – 2013

Slightly more than 3.0 million nonfatal workplace injuries and illnesses were reported by private industry employers in 2013, resulting in an incidence rate of 3.3 cases per 100 equivalent full-time workers, according to estimates from the Survey of Occupational Injuries and Illnesses (SOII) conducted by the U.S. Bureau of Labor Statistics.

The rate reported for 2013 continues the pattern of statistically significant declines that, with the exception of 2012, occurred annually for the last
11 years.

Key findings from the 2013 Survey of Occupational Injuries and Illnesses

 The total recordable cases (TRC) incidence rate of injury and illness reported by private industry employers declined in 2013 from a year earlier, as did the rate for cases of a more serious nature involving days away from work, job transfer, or restriction—commonly referred to as DART— marking the first decline in the DART rate since 2009.
 The rate of reported injuries and illnesses declined significantly in 2013 among the manufacturing, retail trade, and utilities sectors but was statistically unchanged among all other private industry sectors compared to a year earlier.

More from the Bureau of Labor Statistics

Thursday, December 4, 2014

Study: Both Public, Police View Black Kids As Older, Less Innocent Than Whites

According to research published by the American Psychological Association, Black boys as young as 10 are proven to not be given the same presumption of childhood innocence as their White peers. Instead, they’re considered to be much older than what they are, perceived to be guilty, and face police violence if accused of a crime.

The study, published in the Journal of Personality and Social Psychology, sought to examine the extent to which the racial bias exists and how significant the consequences are. Speaking on the report, Phillip Atiba Goff, PhD, explained, “Children in most societies are considered to be in a distinct group with characteristics, such as innocence and the need for protection. Our research found that Black boys can be seen as responsible for their actions at an age when White boys still benefit from the assumption that children are essentially innocent.”

More from News One.

Wednesday, December 3, 2014

Tuesday, December 2, 2014

Hepatitis C and Baby Boomers

Baby boomers who dabbled in intravenous recreational drugs and embraced free love decades ago are now finding that behavior can have a price: hepatitis C.

The deadly viral disease brings few symptoms. In fact, it can live in your body silently for decades, slowly causing severe liver damage, even cancer. About 150 million people worldwide, and 3.2 million Americans, are chronically infected with the virus, according to the World Health Organization (WHO).

Still, even when diagnosed, many patients refuse medicines.

More from Lifescript

Monday, December 1, 2014

Holy Smokes: Number of American Smokers Dwindles, CDC Reports

What a drag for cigarette companies.

Cigarette smoking among adults in America is at its lowest level on record, the Centers for Disease Control and Prevention (CDC) announced Wednesday.

The rate of people smoking dropped from 20.9 percent in 2005 to 17.8 percent in 2013, the lowest rate since the CDC’s Nation Health Interview Survey began keeping records in 1965. Despite an increase in the U.S. population, the total number of adult smokers dropped from 45.1 million in 2005 to 42.1 million in 2013.

More from Newsweek.