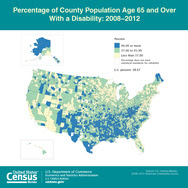
Nearly 40 percent of people age 65 and older had at least one disability, according to a U.S. Census Bureau report that covered the period 2008 to 2012. Of those 15.7 million people, two-thirds of them say they had difficulty in walking or climbing.
Difficulty with independent living, such as visiting a doctor’s office or shopping, was the second-most cited disability, followed by serious difficulty in hearing, cognitive difficulty, difficulty bathing or dressing, and serious difficulty seeing.
While populous states such as California, Florida, New York and Texas had the largest number of older people with a disability, high disability rates were seen in Southern counties, especially in central Appalachia and the Mississippi Delta.
Older Americans With a Disability: 2008-2012, a report based on data collected during the American Community Survey, examines disability status by age, sex and selected socio-economic characteristics, such as marital status, living arrangement, educational attainment and poverty status.
|
Showing posts with label mobility. Show all posts
Showing posts with label mobility. Show all posts
Monday, January 5, 2015
Mobility is Most Common Disability Among Older Americans

Friday, July 26, 2013
In Climbing Income Ladder, Location Matters
From the New York Times:
A new study other researchers are calling the most detailed portrait yet of income mobility in the United States.
The study — based on millions of anonymous earnings records and being released this week by a team of top academic economists — is the first with enough data to compare upward mobility across metropolitan areas. These comparisons provide some of the most powerful evidence so far about the factors that seem to drive people’s chances of rising beyond the station of their birth, including education, family structure and the economic layout of metropolitan areas.
Climbing the income ladder occurs less often in the Southeast and industrial Midwest, the data shows, with the odds notably low in Atlanta, Charlotte, Memphis, Raleigh, Indianapolis, Cincinnati and Columbus. By contrast, some of the highest rates occur in the Northeast, Great Plains and West, including in New York, Boston, Salt Lake City, Pittsburgh, Seattle and large swaths of California and Minnesota.
“Where you grow up matters,” said Nathaniel Hendren, a Harvard economist and one of the study’s authors. “There is tremendous variation across the U.S. in the extent to which kids can rise out of poverty.”
That variation does not stem simply from the fact that some areas have higher average incomes: upward mobility rates, Mr. Hendren added, often differ sharply in areas where average income is similar, like Atlanta and Seattle.
A new study other researchers are calling the most detailed portrait yet of income mobility in the United States.
The study — based on millions of anonymous earnings records and being released this week by a team of top academic economists — is the first with enough data to compare upward mobility across metropolitan areas. These comparisons provide some of the most powerful evidence so far about the factors that seem to drive people’s chances of rising beyond the station of their birth, including education, family structure and the economic layout of metropolitan areas.
Climbing the income ladder occurs less often in the Southeast and industrial Midwest, the data shows, with the odds notably low in Atlanta, Charlotte, Memphis, Raleigh, Indianapolis, Cincinnati and Columbus. By contrast, some of the highest rates occur in the Northeast, Great Plains and West, including in New York, Boston, Salt Lake City, Pittsburgh, Seattle and large swaths of California and Minnesota.
“Where you grow up matters,” said Nathaniel Hendren, a Harvard economist and one of the study’s authors. “There is tremendous variation across the U.S. in the extent to which kids can rise out of poverty.”
That variation does not stem simply from the fact that some areas have higher average incomes: upward mobility rates, Mr. Hendren added, often differ sharply in areas where average income is similar, like Atlanta and Seattle.
Friday, November 18, 2011
Mover Rate Reaches Record Low
The percentage of people who changed residences between 2010 and 2011 ─ 11.6 percent ─ was the lowest recorded rate since the Current Population Survey began collecting statistics on the movement of people in the United States in 1948, the U.S. Census Bureau reported today. The rate, which was 20.2 percent in 1985, declined to a then-record low of 11.9 percent in 2008 before rising to 12.5 percent in 2009. The 2010 rate was not statistically different than the 2009 rate.
This information comes from Geographical Mobility: 2011, a collection of national- and regional-level tables from the Current Population Survey Annual Social and Economic Supplement. The tables shed light on movement of people within the United States from one location to another during the year prior to the survey. These tables were part of four migration-related data products released today, which also included:
Geographical Mobility: 2008 to 2009 [PDF], a report with analysis of various geographic mobility topics. It contains national- and state-level data from the 2009 Current Population Survey and American Community Survey.
2010 American Community Survey state-to-state migration flow tables.
Lifetime Mobility in the United States: 2010 [PDF], a 2010 American Community Survey brief on people who live in the state of their birth.
“Taken together, these products paint a vivid picture of a nation on the move and tell a more complete story than any one of them can separately,” said Alison Fields, chief of the Census Bureau's Journey-to-Work and Migration Statistics Branch. “The record low mover rate was driven by a drop in the likelihood of people moving from one location to another within the same county. The last time this rate was so low, the overall mover rate also reached a record low.”
Reasons for Moving
For those who moved to a different county or state, the reasons for moving varied considerably by the length of their move. According to Geographical Mobility: 2008 to 2009, when people moved a considerable distance between 2008 and 2009 ─ 500 or more miles ─ it was most likely for employment-related reasons, which were cited by 43.9 percent of such movers, as opposed to housing-related reasons, given by 11.6 percent. Conversely, when people didn’t move far ─ less than 50 miles ─ 40.0 percent did so for housing-related reasons.
Living in State of Birth
As of 2010, the majority of Americans (59 percent) lived in the state in which they were born, so says Lifetime Mobility in the United States: 2010. The state with the highest such percentage was Louisiana (78.8 percent), followed by Michigan (76.6 percent), Ohio (75.1 percent) and Pennsylvania (74.0 percent). Conversely, in four states ─ Alaska, Arizona, Florida and Nevada ─ and in the District of Columbia, fewer than 40 percent of residents were born in that state or state-equivalent. Nevada, with less than a quarter, had the lowest percentage in the nation.
The Most Common State-to-State Moves
According to the 2010 American Community Survey, 45.3 million people lived in a different house within the United States one year earlier. Of these movers, 6.7 million lived in a different state. The most common state-to-state moves in 2010 were:
California to Texas (68,959 movers)
New York to Florida (55,011)
Florida to Georgia (49,901)
California to Arizona (47,164)
New Jersey to Pennsylvania (42,456)
New York to New Jersey (41,374)
California to Washington (39,468)
Texas to California (36,582)
Georgia to Florida (35,615)
California to Nevada (35,472)
It should be noted that flows in the top 10 may not be significantly different from each other or flows outside the top 10.
Four years earlier, in the wake of Hurricane Katrina, the most common move was Louisiana to Texas (118,552 moves). Among the next largest moves were New York to Florida (87,576) and California to Arizona (85,497). All in all, 7.9 million people moved between states during the 2005 to 2006 period.
In early 2012, the Census Bureau will release the American Community Survey 2005-2009 County-to-County Migration Flow File, the first data set addressing this topic since the 2000 Census. It will show the number of moves between pairs of counties, with tabulations provided by age, sex, and race and Hispanic origin.
This information comes from Geographical Mobility: 2011, a collection of national- and regional-level tables from the Current Population Survey Annual Social and Economic Supplement. The tables shed light on movement of people within the United States from one location to another during the year prior to the survey. These tables were part of four migration-related data products released today, which also included:
Geographical Mobility: 2008 to 2009 [PDF], a report with analysis of various geographic mobility topics. It contains national- and state-level data from the 2009 Current Population Survey and American Community Survey.
2010 American Community Survey state-to-state migration flow tables.
Lifetime Mobility in the United States: 2010 [PDF], a 2010 American Community Survey brief on people who live in the state of their birth.
“Taken together, these products paint a vivid picture of a nation on the move and tell a more complete story than any one of them can separately,” said Alison Fields, chief of the Census Bureau's Journey-to-Work and Migration Statistics Branch. “The record low mover rate was driven by a drop in the likelihood of people moving from one location to another within the same county. The last time this rate was so low, the overall mover rate also reached a record low.”
Reasons for Moving
For those who moved to a different county or state, the reasons for moving varied considerably by the length of their move. According to Geographical Mobility: 2008 to 2009, when people moved a considerable distance between 2008 and 2009 ─ 500 or more miles ─ it was most likely for employment-related reasons, which were cited by 43.9 percent of such movers, as opposed to housing-related reasons, given by 11.6 percent. Conversely, when people didn’t move far ─ less than 50 miles ─ 40.0 percent did so for housing-related reasons.
Living in State of Birth
As of 2010, the majority of Americans (59 percent) lived in the state in which they were born, so says Lifetime Mobility in the United States: 2010. The state with the highest such percentage was Louisiana (78.8 percent), followed by Michigan (76.6 percent), Ohio (75.1 percent) and Pennsylvania (74.0 percent). Conversely, in four states ─ Alaska, Arizona, Florida and Nevada ─ and in the District of Columbia, fewer than 40 percent of residents were born in that state or state-equivalent. Nevada, with less than a quarter, had the lowest percentage in the nation.
The Most Common State-to-State Moves
According to the 2010 American Community Survey, 45.3 million people lived in a different house within the United States one year earlier. Of these movers, 6.7 million lived in a different state. The most common state-to-state moves in 2010 were:
California to Texas (68,959 movers)
New York to Florida (55,011)
Florida to Georgia (49,901)
California to Arizona (47,164)
New Jersey to Pennsylvania (42,456)
New York to New Jersey (41,374)
California to Washington (39,468)
Texas to California (36,582)
Georgia to Florida (35,615)
California to Nevada (35,472)
It should be noted that flows in the top 10 may not be significantly different from each other or flows outside the top 10.
Four years earlier, in the wake of Hurricane Katrina, the most common move was Louisiana to Texas (118,552 moves). Among the next largest moves were New York to Florida (87,576) and California to Arizona (85,497). All in all, 7.9 million people moved between states during the 2005 to 2006 period.
In early 2012, the Census Bureau will release the American Community Survey 2005-2009 County-to-County Migration Flow File, the first data set addressing this topic since the 2000 Census. It will show the number of moves between pairs of counties, with tabulations provided by age, sex, and race and Hispanic origin.
Wednesday, June 29, 2011
Geographical Mobility/Migration
From The American Consumers Newsletter:
The mobility rate of the nation's homeowners remained at the record low of 5.2 percent in 2009-10, unchanged from the rate of 2008-09. The Census Bureau's latest geographic mobility figures, available at this site, show a nation of movers paralyzed by the collapse of the housing market. Among renters, a much larger 29.0 percent moved in 2009-10, down slightly from the 29.6 percent who moved between 2008-09. Renter mobility has changed little over the decade--it peaked at 30.8 percent in 2001-02. During the past decade, homeowner mobility has been as high as 8.1 percent
http://www.census.gov/hhes/migration/data/cps/cps2010.html
The mobility rate of the nation's homeowners remained at the record low of 5.2 percent in 2009-10, unchanged from the rate of 2008-09. The Census Bureau's latest geographic mobility figures, available at this site, show a nation of movers paralyzed by the collapse of the housing market. Among renters, a much larger 29.0 percent moved in 2009-10, down slightly from the 29.6 percent who moved between 2008-09. Renter mobility has changed little over the decade--it peaked at 30.8 percent in 2001-02. During the past decade, homeowner mobility has been as high as 8.1 percent
http://www.census.gov/hhes/migration/data/cps/cps2010.html
Wednesday, June 1, 2011
Subscribe to:
Posts (Atom)