To commemorate and celebrate the contributions to our nation made by people of African descent, American historian Carter G. Woodson established Black History Week. The first celebration occurred on Feb. 12, 1926. For many years, the second week of February was set aside for this celebration to coincide with the birthdays of abolitionist/editor Frederick Douglass and Abraham Lincoln. In 1976, as part of the nation’s bicentennial, the week was expanded to a month. Since then, U.S. presidents have proclaimed February as National African-American History Month.
The following facts are made possible by the invaluable responses to the U.S. Census Bureau’s surveys. We appreciate the public’s cooperation as we continuously measure America’s people, places, and economy.
Note: The reference to the black population in this publication is to single-race black people (“black alone”) unless otherwise noted.
Did You Know?
The black population, either alone or in combination with one or more races, in the United States. Source: 2016 Population Estimates
The number of black military veterans in the United States nationwide. Source: 2016 American Community Survey
The percentage of the black population 16 and older working in management, business, science and arts occupations in 2016. Source: 2016 American Community Survey(Source includes more on occupations, commuting, and industries.)
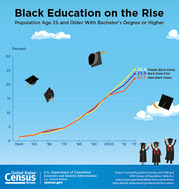
Percentage of African-Americans completing high school. Source: 2016 Current Population Survey (Source includes more on education, including advanced degrees and school enrollment.)
The number of black-owned employer firm businesses in the United States in 2015. Source: 2015 Annual Survey of Entrepreneurs
More on Population Size
Voting Rates
Income, Poverty and Health Insurance
· Income
More Stats
See a detailed profile of the black population from the 2016 American Community Survey. Statistics include:
· Families and children
· Marital status
· Grandparents living with grandchildren
· Jobs
· Labor force participation
· Occupation
· Commuting
· Housing
Related News Products
Past Facts for Features
Stats for Stories
Releases
Graphics
|
Showing posts with label black Americans. Show all posts
Showing posts with label black Americans. Show all posts
Friday, February 2, 2018
Black) History Month: February 2018

Tuesday, January 27, 2015
Black (African-American) History Month: February 2015
To commemorate and celebrate the contributions to our nation made by people of African descent, American historian Carter G. Woodson established Black History Week. The first celebration occurred on Feb. 12, 1926. For many years, the second week of February was set aside for this celebration to coincide with the birthdays of abolitionist/editor Frederick Douglass and Abraham Lincoln. In 1976, as part of the nation’s bicentennial, the week was expanded into Black History Month. Each year, U.S. presidents proclaim February as National African-American History Month.
Population
45.0 million
The number of blacks, either alone or in combination with one or more other races, on July 1, 2013,up 1.0 percent from July 1, 2012. Source: Population Estimates <http://factfinder2.census.
Monday, January 19, 2015
African American History: More Than Civil Rights
When we teach African American history we discuss slavery and the fight for equality. These are essential conversations, but there is so much more than that. African Americans have made significant contributions in all fields of study, including science and technology, the arts, and medicine. This February, we celebrate African American History month. We’ve provided a list of resources that discuss the fundamentals of African American history and a few that highlight achievements in the arts and sciences:
- Guide: African-American Mosaic
- Lesson Plan: Revolution '67: Protest: Why and How
- Videos: Civil Rights - National Archives
Monday, October 6, 2014
How the War on Drugs Damages Black Social Mobility
The social mobility of black Americans has suffered collateral damage from the “War on Drugs.” Being convicted of a crime has devastating effects on the employment prospects and incomes of ex-felons and their children... These findings are often used to motivate efforts to reduce criminal behavior. They should also motivate changes in our criminal justice system, which unfairly punishes black Americans—often for victimless crimes that whites are at least as likely to commit.
An estimated one-third of black male Americans will spend time in state or federal prison at some point in their lifetime – more than double the rate from the 1970s and over five times higher than the rate for white males.
What’s driving the imprisonment of black men? Arrest data show a striking trend: arrests of blacks have fallen for violent and property crimes, but soared for drug related crimes. As of 2011, drug crimes comprised 14 percent of all arrests and a miscellaneous category that includes “drug paraphernalia” possession comprised an additional 31 percent of all arrests. Just 6 percent and 14 percent of arrests were for violent and property crimes, respectively.
More from Brookings.
An estimated one-third of black male Americans will spend time in state or federal prison at some point in their lifetime – more than double the rate from the 1970s and over five times higher than the rate for white males.
What’s driving the imprisonment of black men? Arrest data show a striking trend: arrests of blacks have fallen for violent and property crimes, but soared for drug related crimes. As of 2011, drug crimes comprised 14 percent of all arrests and a miscellaneous category that includes “drug paraphernalia” possession comprised an additional 31 percent of all arrests. Just 6 percent and 14 percent of arrests were for violent and property crimes, respectively.
More from Brookings.
Thursday, July 3, 2014
The Worst State in America for Black Children
From Identities.MIC:

Black families pondering a move to the Midwest might want to read this, especially if they have young children. According to a national report, Wisconsin has been ranked the worst state in the country when it comes to racial disparities for children.
The Annie E. Casey Foundation, a 66-year-old charitable organization concentrating on family issues and well-being, spearheaded the study. "Race for Results: Building a Path to Opportunity for All Children" scored states according to 12 different factors, from educational access to socioeconomic status and home life.
Wisconsin scored a 238 on its ability to prepare black children for educational and financial success, the lowest of all states (the average score was 345). Interestingly, Wisconsin was ranked 10th overall in its preparation for white children.
Thursday, May 9, 2013
Blacks Voted at a Higher Rate than Whites in 2012 Election
About two in three eligible blacks (66.2 percent) voted in the 2012 presidential election, higher than the 64.1 percent of non-Hispanic whites who did so, according to a U.S. Census Bureau report released today. This marks the first time that blacks have voted at a higher rate than whites since the Census Bureau started publishing statistics on voting by the eligible citizen population in 1996.
These findings come from The Diversifying Electorate — Voting Rates by Race and Hispanic Origin in 2012 (and Other Recent Elections), which provides analysis of the likelihood of voting by demographic factors, such as race, Hispanic origin, sex, age and geography (specifically, census divisions). The report draws upon data from the November 2012 Current Population Survey Voting and Registration Supplement and looks at presidential elections back to 1996. Using the race definitions from 1968 and the total voting-age population, whites voted at higher rates than blacks in every presidential election between 1968, when the Census Bureau began publishing voting data by race, and 1992.
Blacks were the only race or ethnic group to show a significant increase between the 2008 and 2012 elections in the likelihood of voting (from 64.7 percent to 66.2 percent). The 2012 increase in voting among blacks continues what has been a long-term trend: since 1996, turnout rates have risen 13 percentage points to the highest levels of any recent presidential election. In contrast, after reaching a high in 2004, non-Hispanic white voting rates have dropped in two consecutive elections. Between 2008 and 2012, rates for non-Hispanic whites dropped from 66.1 percent to 64.1 percent. As recently as 1996, blacks had turnout rates 8 percentage points lower than non-Hispanic whites.
Overall, the percentage of eligible citizens who voted declined from 63.6 percent in 2008 to 61.8 percent in 2012.
Both blacks and non-Hispanic whites had voting rates higher than Hispanics and Asians in the 2012 election (about 48 percent each).
“Blacks have been voting at higher rates, and the Hispanic and Asian populations are growing rapidly, yielding a more diverse electorate,” said Thom File, a sociologist in the Census Bureau’s Education and Social Stratification Branch and the report’s author. “Over the last five presidential elections, the share of voters who were racial or ethnic minorities rose from just over one in six in 1996 to more than one in four in 2012.”
Between 1996 and 2012, blacks, Asians and Hispanics all had an increase in their shares of the voting population, with the Hispanic share increasing by about 4 percentage points and the black share by about 3 points.
The number of blacks who voted rose by about 1.7 million between the 2008 and 2012 elections. Likewise, the number of Hispanics who voted increased by 1.4 million and the number of Asians by 550,000. At the same time, the number of non-Hispanic white voters declined by about 2 million ─ the only such drop for any single-race group between elections since 1996. The figures for blacks and Hispanics are not significantly different from each other.
Gender and Age Differences
The report also shows that the “gender gap” in voting persists. In every presidential election since 1996, women have voted at higher rates than men. In 2012, the spread was about 4 percentage points. The gap was especially wide among black voters, among whom it reached 9 percentage points in 2012. Asians are the only race or Hispanic-origin group that showed no significant gender gap.
There were large declines in youth voting among all race groups and Hispanics in 2012. Non-Hispanic whites age 18 to 24 and 25 to 44 showed statistically significant voting rate decreases, as did young Hispanics 18 to 24 years of age. The only race/Hispanic-origin/age combinations showing voting rate increases in 2012 were blacks ages 45 to 64 and 65 and older.
Other highlights:
--Voting rates increase with age: in 2012, the percentage of eligible adults who voted ranged from 41.2 percent for 18- to 24-year-olds, to a high of 71.9 percent for those 65 and older.
--Although blacks voted at higher rates than non-Hispanic whites nationally in 2012, this result was not uniform across the country. In the East North Central, East South Central, Middle Atlantic, and South Atlantic divisions, blacks voted at higher rates than non-Hispanic whites. In the Mountain and Pacific divisions, non-Hispanic whites voted at higher rates than blacks. In the New England, West North Central and West South Central divisions, voting rates for the two groups were not significantly different from each other.
These findings come from The Diversifying Electorate — Voting Rates by Race and Hispanic Origin in 2012 (and Other Recent Elections), which provides analysis of the likelihood of voting by demographic factors, such as race, Hispanic origin, sex, age and geography (specifically, census divisions). The report draws upon data from the November 2012 Current Population Survey Voting and Registration Supplement and looks at presidential elections back to 1996. Using the race definitions from 1968 and the total voting-age population, whites voted at higher rates than blacks in every presidential election between 1968, when the Census Bureau began publishing voting data by race, and 1992.
Blacks were the only race or ethnic group to show a significant increase between the 2008 and 2012 elections in the likelihood of voting (from 64.7 percent to 66.2 percent). The 2012 increase in voting among blacks continues what has been a long-term trend: since 1996, turnout rates have risen 13 percentage points to the highest levels of any recent presidential election. In contrast, after reaching a high in 2004, non-Hispanic white voting rates have dropped in two consecutive elections. Between 2008 and 2012, rates for non-Hispanic whites dropped from 66.1 percent to 64.1 percent. As recently as 1996, blacks had turnout rates 8 percentage points lower than non-Hispanic whites.
Overall, the percentage of eligible citizens who voted declined from 63.6 percent in 2008 to 61.8 percent in 2012.
Both blacks and non-Hispanic whites had voting rates higher than Hispanics and Asians in the 2012 election (about 48 percent each).
“Blacks have been voting at higher rates, and the Hispanic and Asian populations are growing rapidly, yielding a more diverse electorate,” said Thom File, a sociologist in the Census Bureau’s Education and Social Stratification Branch and the report’s author. “Over the last five presidential elections, the share of voters who were racial or ethnic minorities rose from just over one in six in 1996 to more than one in four in 2012.”
Between 1996 and 2012, blacks, Asians and Hispanics all had an increase in their shares of the voting population, with the Hispanic share increasing by about 4 percentage points and the black share by about 3 points.
The number of blacks who voted rose by about 1.7 million between the 2008 and 2012 elections. Likewise, the number of Hispanics who voted increased by 1.4 million and the number of Asians by 550,000. At the same time, the number of non-Hispanic white voters declined by about 2 million ─ the only such drop for any single-race group between elections since 1996. The figures for blacks and Hispanics are not significantly different from each other.
Gender and Age Differences
The report also shows that the “gender gap” in voting persists. In every presidential election since 1996, women have voted at higher rates than men. In 2012, the spread was about 4 percentage points. The gap was especially wide among black voters, among whom it reached 9 percentage points in 2012. Asians are the only race or Hispanic-origin group that showed no significant gender gap.
There were large declines in youth voting among all race groups and Hispanics in 2012. Non-Hispanic whites age 18 to 24 and 25 to 44 showed statistically significant voting rate decreases, as did young Hispanics 18 to 24 years of age. The only race/Hispanic-origin/age combinations showing voting rate increases in 2012 were blacks ages 45 to 64 and 65 and older.
Other highlights:
--Voting rates increase with age: in 2012, the percentage of eligible adults who voted ranged from 41.2 percent for 18- to 24-year-olds, to a high of 71.9 percent for those 65 and older.
--Although blacks voted at higher rates than non-Hispanic whites nationally in 2012, this result was not uniform across the country. In the East North Central, East South Central, Middle Atlantic, and South Atlantic divisions, blacks voted at higher rates than non-Hispanic whites. In the Mountain and Pacific divisions, non-Hispanic whites voted at higher rates than blacks. In the New England, West North Central and West South Central divisions, voting rates for the two groups were not significantly different from each other.
Monday, January 28, 2013
Black History Month: February 2013
To commemorate and celebrate the contributions to our nation made by people of African descent, American historian Carter G. Woodson established Black History Week. The first celebration occurred on Feb. 12, 1926. For many years, the second week of February was set aside for this celebration to coincide with the birthdays of abolitionist/editor Frederick Douglass and Abraham Lincoln. In 1976, as part of the nation's bicentennial, the week was expanded into Black History Month. Each year, U.S. presidents proclaim February as National African-American History Month.
Profile America: Facts for Features
Profile America: Facts for Features
Saturday, October 9, 2010
Prison Mortality
Although access to this research (which appeared in the August 2010 issue of Demography) is restricted, the astounding results published in the article, "Incarcerating Death: Mortality in U.S. State Correctional Facilities, 1985-1998," are worthy of attention. In the article, Vanderbilt University sociologist Evelyn J. Patterson compares the mortality rate of men in state correctional facilities with the rate of men who are not in prison. She discovers that imprisoned black men have a lower mortality rate than black men who are not in prison. After controlling for firearm and motor vehicle deaths, the mortality rate for imprisoned black men is still lower. The reason, suggests Patterson, is that imprisoned black men have greater access to basic health care than their counterparts outside prison walls.
Thursday, July 29, 2010
Asian, Black Population in the U.S.
The Asian Population in the United States: 2007 and 2008
The Black Population in the United States: 2007 and 2008
A series of detailed tables with data on a wide range of demographic and socioeconomic characteristics of the specified population. Topics covered include marital status, educational attainment, nativity and citizenship status, labor force and employment status, occupation, earnings, poverty and housing tenure.
The Black Population in the United States: 2007 and 2008
A series of detailed tables with data on a wide range of demographic and socioeconomic characteristics of the specified population. Topics covered include marital status, educational attainment, nativity and citizenship status, labor force and employment status, occupation, earnings, poverty and housing tenure.
Subscribe to:
Posts (Atom)