The U.S. Census Bureau released selected characteristics of the citizen voting-age population from the 2015 American Community Survey for all U.S. states and congressional districts.
These characteristics include selected age groups, sex, race, Hispanic origin, educational attainment, poverty status and household income.
Showing posts with label population. Show all posts
Monday, October 31, 2016
Thursday, May 19, 2016
|
Thursday, March 31, 2016
Population is dropping faster in upstate New York counties
From Empire Center:
Upstate New York’s population began to decline at a faster rate between mid-2014 and 2015, according to updated Census Bureau estimates.
As of last July 1, the 50 counties north of the mid-Hudson Valley had a combined population of 6,307,573—down 17,623 from the Census Bureau estimate of a year earlier. The drop in 2014-15 alone exceeded the population decrease in the previous four years, bringing the total population decline since the 2010 census to 31,740 people, or 0.5 percent. By contrast, upstate New York’s population increased by 52,074, or 0.8 percent, between 2000 and 2010.
Upstate New York’s population began to decline at a faster rate between mid-2014 and 2015, according to updated Census Bureau estimates.
As of last July 1, the 50 counties north of the mid-Hudson Valley had a combined population of 6,307,573—down 17,623 from the Census Bureau estimate of a year earlier. The drop in 2014-15 alone exceeded the population decrease in the previous four years, bringing the total population decline since the 2010 census to 31,740 people, or 0.5 percent. By contrast, upstate New York’s population increased by 52,074, or 0.8 percent, between 2000 and 2010.
Labels:
New York State,
population,
upstate New York
Monday, March 28, 2016
U.S. Population Aging Slower than Other Countries
America’s 65-and-over population is projected to nearly double over the next three decades, ballooning from 48 million to 88 million by 2050. However, the U.S. Census Bureau projects the U.S. population will age at a slower rate compared with other countries.
Worldwide, the 65-and-over population will more than double to 1.6 billion by 2050, according to An Aging World: 2015. This new report from the Census Bureau examines the continuing global aging trend and projected growth of the population age 65 and over, with an emphasis on the differences among world regions.
In 2015, 14.9 percent of the U.S. population was 65 or over.
“The United States was the 48th oldest country out of 228 countries and areas in the world in 2015,” said Wan He, a demographer on population aging research at the Census Bureau. “Baby boomers began reaching age 65 in 2011 and by 2050 the older share of the U.S. population will increase to 22.1 percent. However, the U.S. will fall to 85th because of the more rapid pace of aging in many Asian and Latin American countries.”
Japan is the current oldest country in the world and will retain that position in 2050.
“However, South Korea, Hong Kong and Taiwan are projected to overtake Germany, Italy and Greece for second, third and fourth place by 2050,” He said.
Some countries, including China, India, Indonesia, Brazil, Colombia and Cuba, will experience a quadrupling of their oldest-old population, those 80 and over, from 2015 to 2050.
While Europe is still the oldest region today and is projected to remain so by 2050, aging in Asia and Latin America has accelerated in recent decades. Asia is also notable for leading the world in the size of the older population with 341 million people 65 and older. On the other hand, Africa remained young in 2015, where only 3.5 percent of the total population was 65 and over.
Other highlights:
Employment
· Labor force participation among the older population continues to rise in many developed countries, yet remains highest in low-income countries.
Tuesday, December 29, 2015
Tuesday, December 22, 2015
North Carolina Becomes 9th State With 10 Million or More People
By adding an average of 281 people per day during the last year, North Carolina’s population crossed the 10 million mark, making the state the ninth in that category, according to U.S. Census Bureau state population estimates released today.
North Carolina’s population gain over the July 1, 2014, to July 1, 2015, period ranked it behind only Texas, Florida, California, Georgia and Washington.
Notably, Florida added more people than California for the first time in nearly a decade. Florida’s gain of 365,703 people also pushed it past 20 million, becoming the third state to reach that milestone. California continued to be the most populous state on July 1, 2015, with 39.1 million, followed by Texas with 27.5 million.
North Dakota was the nation’s fastest-growing state or equivalent over the last year, for the fourth year in a row. Its population increased 2.3 percent, followed by 1.9 percent growth in Colorado, the District of Columbia and Nevada. Each of the 10 fastest-growing states was in the South or West with the exception of North Dakota.
Seven states lost population between July 1, 2014, and July 1, 2015: Illinois
Thursday, October 15, 2015
What Are The Demographics Of Heaven?
As you might expect, that total number of dead people has grown a lot over time. The U.S. Census Bureau has collected several of the sources for historical world population rates. The estimates differ for two major reasons — the demographers don’t all agree about which date to take as the starting point for human life, and they also estimate population growth differently...
Most of those people who have been born are no longer with us. What’s really fascinating, though, is how the dead-to-living ratio is expected to change in the future. By 2050, the world’s population is expected to grow to 9.7 billion. Which means that in 35 years’ time, the living would make up 8.6 percent of those who have ever been born. And the dead would outnumber the living 11 to 1.
More from FiveThirtyEight
Most of those people who have been born are no longer with us. What’s really fascinating, though, is how the dead-to-living ratio is expected to change in the future. By 2050, the world’s population is expected to grow to 9.7 billion. Which means that in 35 years’ time, the living would make up 8.6 percent of those who have ever been born. And the dead would outnumber the living 11 to 1.
More from FiveThirtyEight
Friday, September 4, 2015
World Population Clock Updated with New Features
The U.S. Census Bureau recently updated its popular World Population Clock Web tool with features and information for 228 countries. In addition to featuring the 10 most populous countries, already available in the clock, it now includes country profiles with trade and population statistics, such as total population, population per square kilometer, and goods exported from and imported to the United States. Additional features include graphics on population projections and top exported goods by U.S. state or territory.
Along with the updated clock, another new tool, the International Map Viewer, is now available. This tool shows the four most commonly requested demographic measures for foreign countries using statistics from the International Data Base — total population, growth rate percent, life expectancy at birth and infant mortality rate — by clicking on a world map.
Public Information Office
|
Labels:
Census Bureau,
population,
population clock,
world
Friday, July 10, 2015
2015 International Population Estimates and Projections
In time for World Population Day (July 11), the Census Bureau has released an update of population estimates and projections for 24 countries, including China, Jordan, Malawi, Syria and Ukraine through its International Data Base.
The International Data Base contains population estimates and projections to 2050 for 228 countries and areas. Along with total population, characteristics for countries include age structure, fertility and mortality rates, and migration numbers.Additional analyses for some countries have been conducted to include the estimated effects of HIV/AIDS. As of July 1, 2015, the world population reached 7.256 billion.
Labels:
Census Bureau,
HIV,
international,
population
Thursday, May 21, 2015
Ten U.S. Cities Now Have 1 Million People or More; California and Texas Each Have Three
Saturday, April 25, 2015
Estimates of U.S. Population by Age and Sex: April 1, 2010 to July 1, 2014
A downloadable file containing estimates of the resident U.S. population by single year of age and sex has been released on the Population Estimates webpage http://www.census.gov/popest/data/datasets.html.
Thursday, March 26, 2015
Metro Areas and Counties that Propelled Growth in Florida and the Nation
Labels:
counties,
metropolitan areas,
population
Monday, March 9, 2015
Census Bureau Report Analyzes U.S. Population Projections
|
Wednesday, March 4, 2015
U.S. Cities are Home to 62.7% of U.S. Population, but Comprise Just 3.5% of Land Area
A majority of the U.S. population lives in incorporated places or cities, although these areas only make up a small fraction of the U.S. land area, according to a new report released today by the U.S. Census Bureau. The percentage of the population living in cities in 2013 was highest in the Midwest and West at 71.2 percent and 76.4 percent, respectively.
“The higher percentage of people living in cities in the West can partly be explained by the limited access to water outside of western cities and federally held land surrounding many of these cities, which limits growth outside incorporated areas,” said Darryl Cohen, a Census Bureau analyst and the report’s author. “This is especially true in Utah, where 88.4 percent of the population lives in an incorporated place.”
The report, Population Trends in Incorporated Places: 2000 to 2013, draws from population estimates data on more than 19,000 cities across the U.S., including trends in population growth and loss, population density, geographic distribution, annexation and new incorporations.
Friday, January 23, 2015
Release of 2014 U.S. and State Population Estimates
July 1, 2014 population estimates are now available for the nation, states and Puerto Rico on American FactFinder. The annual estimates include components of change (births, deaths and net migration) in the previous year and since the April 1, 2010 Census. The estimates were originally released on Dec. 23, 2014, on the Population and Housing Unit Estimates website (http://www.census. gov/popest).
In addition, new monthly estimates are now available for the nation for April 1, 2010 to Jan. 1, 2015. These monthly estimates are for the resident population, resident population plus armed forces overseas, civilian population, civilian noninstitutionalized population and household population.
Labels:
American Factfinder,
Census Bureau,
population
Thursday, January 1, 2015
Mapping Migration in the United States
The charts show striking patterns for many states: You can trace the rise of migrant and immigrant populations all along the Southwest, particularly in Texas and Arizona; the influx of New Yorkers and other Northeasterners into Florida starting in the 1970s; and the growth in the Southern share of the Illinois population during the Great Migration.
In 1900, 95 percent of the people living in the Carolinas were born there, with similarly high numbers all through the Southeast. More than a hundred years later, those percentages are nearly cut in half.
More from the New York Times.
In 1900, 95 percent of the people living in the Carolinas were born there, with similarly high numbers all through the Southeast. More than a hundred years later, those percentages are nearly cut in half.
More from the New York Times.
Tuesday, December 30, 2014
Population of locations involved in determining the nation’s top team in college football
The U.S. Census Bureau presents a graphic that shows the population of the cities and metropolitan areas involved in the first-ever four-team playoff in college football’s top division. In the first semifinal on Thursday, Jan. 1, No. 2-ranked Oregon (Eugene, Ore.) takes on No. 3 Florida State (Tallahassee, Fla.) in Pasadena, Calif. In the other semifinal, top-ranked Alabama (Tuscaloosa, Ala.) faces No. 4 Ohio State (Columbus, Ohio) in New Orleans. The championship game will be on Monday, Jan. 12 in Arlington, Texas.
Monday, December 29, 2014
Census Bureau Projects U.S. and World Populations on New Year's Day
As the nation prepares to ring in the new year, the U.S. Census Bureau today projected the United States population will be 320,090,857 on Jan. 1, 2015. This represents an increase of 2,334,187, or 0.73 percent, from New Year’s Day 2014, and 11,345,319, or 3.67 percent, since Census Day (April 1) 2010.
|
Tuesday, December 23, 2014
Florida Passes New York to Become the Nation’s Third Most Populous State
From the Census Bureau:
By adding an average of 803 new residents each day between July 1, 2013 and July 1, 2014, Florida passed New York to become the nation’s third most populous state, according to U.S. Census Bureau state population estimates released today. Florida’s population grew by 293,000 over this period, reaching 19.9 million. The population of New York increased by 51,000 to 19.7 million.
California remained the nation’s most populous state in 2014, with 38.8 million residents, followed by Texas, at 27.0 million. Although the list of the 10 most populous states overall was unchanged, two other states did change positions, as North Carolina moved past Michigan to take the ninth spot.
Another milestone took place in Georgia (ranked 8th), which saw its population surpass 10 million for the first time.
North Dakota was the nation’s fastest-growing state over the last year. Its population increased 2.2 percent, followed by the 1.7 percent growth in Nevada and Texas. Each of the 10 fastest-growing states was in the South or West with the exception of North Dakota.
Six states lost population between July 1, 2013, and July 1, 2014: Illinois (9,972 or -0.08 percent), West Virginia (3,269 or -0.18 percent), Connecticut (2,664 or -0.07 percent), New Mexico (1,323 or -0.06 percent, Alaska (527 or -0.07 percent) and Vermont (293 or -0.05 percent).
The United States as a whole saw its population increase by 2.4 million to 318.9 million, or 0.75 percent.
Labels:
Census Bureau,
Florida,
New York,
population
Friday, December 12, 2014
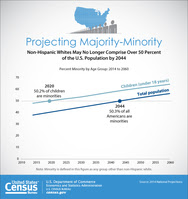
U.S. Population Projections: 2014-2060
The Population Projections Program produces projections of the United States resident population by age, sex, race, Hispanic origin, and nativity. The 2014 National Projections are based on the July 1, 2013 population estimates, which are based on the 2010 Census, and provide projections of the population for July 1, 2014 to July 1, 2060. The projections were produced using a cohort-component method and are based on assumptions about future births, deaths, and net international migration.
More from the Census Bureau, which releases new national projections periodically.
Subscribe to:
Posts (Atom)