Friday, December 8, 2017

Commuting, Median Rents and Language Other Than English

New American Community Survey Statistics Provide Local Data for Every Community Nationwide
English
DEC. 7, 2017 — The nation experienced an increase in commuting times and median gross rent along with a rise in English proficiency among those who spoke another language. These are only a few of the statistics released today from the U.S. Census Bureau’s 2012-2016 American Community Survey five-year estimates, which features more than 40 social, economic, housing and demographic topics, including homeowner rates and costs, health insurance and educational attainment.
“The American Community Survey allows us to track incremental changes across our nation on how people live and work, year-to-year,” said David Waddington, chief of the Social, Economic, and Housing Statistics Division. “It’s our country’s only source of small area estimates for socio-economic and demographic characteristics. These estimates help people, businesses and governments throughout the country better understand the needs of their populations, the markets in which they operate and the challenges and opportunities they face.”
The survey produces statistics for all of the nation’s 3,142 counties. In addition, it is the only full dataset available for three-fourths of all counties with populations too small to produce a complete set of single-year statistics (2,322 counties). Each year, Census Bureau data helps determine how more than $675 billion of federal funding are spent on infrastructure and services, from highways to schools to hospitals.
Data Highlights
The following highlights are from the 2012-2016 American Community Survey five-year estimates release, unless otherwise noted.
Commuting Characteristics
Between 2012 and 2016, the average commute time for the nation was 26.1 minutes, an increase of 0.7 minutes from 25.4 minutes in the 2007-2011 American Community Survey five-year estimates data.
·       The longest average one-way travel times are generally associated with larger metro areas or smaller metro areas within commuting distance of a larger metro area. Among the longest were:
o   East Stroudsburg, Pa., metropolitan area (38.6 minutes).
o   New York-Newark-Jersey City, N.Y.-N.J.-Pa., metropolitan area (35.9 minutes).
o   Washington-Arlington-Alexandria, D.C-Va.-Md.-W.V., metropolitan area (34.4 minutes).
·       The shortest average one-way travel times are usually associated with smaller metro areas. Among the shortest were:
o   Walla Walla, Wash., metropolitan area (15.4 minutes).
o   Grand Forks, N.D.-Minn., metropolitan area (15.5 minutes).
o   Great Falls, Mont., metropolitan area (15.6 minutes).
The travel times for Walla Walla, Grand Forks and Great Falls metro areas are not statistically different from each other.
·       About 7.5 million workers (5.1 percent) commute by bus, subway, commuter rail, light rail or some other form of public transportation on a typical workday. Public transportation usage is highly concentrated within the nation’s large metro areas.
·       Among metro areas with high rates of public transportation commuting:
o    The New York-Northern New Jersey-Long Island, N.Y.-N.J.-Pa., metropolitan area stands out with 31.0 percent of workers (2,918,906 people) commuting by transit.
o    The San Francisco-Oakland-Hayward, Calif., metropolitan area and the Washington-Arlington-Alexandria, D.C.-Va.-Md.-W.V., metropolitan area are at 16.5 percent (369,759 people) and 14.0 percent (443,870 people), respectively.
·       County-level commuting data are available here.
Language Spoken at Home and English-Speaking Ability
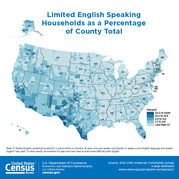
Between 2012 and 2016, 21.1 percent (63,172,059) of the population age 5 and older spoke a language other than English at home, an increase from 20.3 percent in the 2007-2011 American Community Survey five-year estimates data.
·       Of those who spoke a language other than English at home, 59.7 percent (37,731,103) also spoke English “very well.” This proportion increased from 57.1 percent in 2007-2011.
·       New data for five languages are available on American Fact Finder Table B16001: Haitian, Punjabi, Bengali, Telugu and Tamil.
o   There were 806,254 people ages 5 and older who spoke Haitian at home. Almost half (48.8 percent) lived in Florida.
o   Of the 280,867 people ages 5 and older who spoke Punjabi at home, 48.0 percent lived in California.
o   Of the 259,204 people ages 5 and older who spoke Bengali at home, 38.6 percent lived in New York.
o   The 321,695 people ages 5 and older who spoke Telugu at home and the 238,699 people speaking Tamil at home were more evenly distributed across many parts of the nation. For both languages, the highest concentration of speakers lived in California, followed by Texas and New Jersey (the number of persons who spoke Tamil in Texas and New Jersey are not statistically different).
Median Gross Rent
The United States experienced a $21 increase in median gross rent — from $928 in 2007-2011 (adjusted for inflation), to $949 in 2012-2016.
·       The 50 most populous metropolitan areas had increases in median gross rent that outnumbered decreases four to one. There were 32 increases, eight decreases and nine that had no change from 2007-2011 data. (Comparisons for the Los Angeles-Long Beach-Anaheim, Calif., metropolitan area cannot be made due to boundary changes.)
·       Of the 551 micropolitan areas, 146 changed, increases outnumbering decreases two to one with 107 increases and 39 decreases.
County-level gross rent data are available here.
Income
·       Of the 3,142 counties in the United States, 563 counties (17.9 percent) experienced a decline in median household income, while median household income increased in 234 counties (7.4 percent).
·       Among the more than 29,000 places in the United States, 3,254 places (11.1 percent) experienced a decline in median household income, while 926 places (3.2 percent) experienced income growth.
·       For the period of 2012 to 2016, the locations with the highest and lowest median household incomes were:
o   By county and county equivalent:
·        Loudon County, Va., Falls Church City, Va., Fairfax County, Va., Howard County, Md., and Arlington County, Va., were among the highest.
·        McCreary County, Ky., Sumter County, Ala., Holmes County, Miss., Stewart County, Ga., and Lee County, Ky., were among the lowest.
o    By metropolitan statistical area:
·        San Jose-Sunnyvale-Santa Clara, Calif., Washington-Arlington-Alexandria, D.C.-Va.-Md.-W.V., California-Lexington Park, Md., Bridgeport-Stamford-Norwalk, Conn., and San Francisco-Oakland-Hayward, Calif., metropolitan statistical areas were among the highest.
·        Brownsville-Harlingen, Texas, Sebring, Fla., McAllen-Edinburg-Mission, Texas, Pine Bluff, Ark., and Valdosta, Ga., metropolitan statistical areas were among the lowest.
o    By micropolitan statistical area:
·        Los Alamos, N.M., Summit Park, Utah, Williston, N.D., Juneau, Alaska, and Gillette, Wyo., micropolitan statistical areas were among the highest.
·        Middlesborough, Ky., Rio Grande City, Texas, Helena-West Helena, Ark., Las Vegas, N.M., and Indianola, Miss., micropolitan statistical areas were among the lowest.
Poverty
·       Of the 3,142 counties across the nation, 167 counties (5.3 percent) experienced a decline in poverty rates, while 566 counties (18.0 percent) showed a rate increase.
·       Looking at the more than 29,000 places in the United States, 1,391 places (4.7 percent) experienced a decline in poverty rates, while 2,927 places (10.0 percent) had their poverty rates increase.
·       From 2012 to 2016, among geographic areas with 10,000 people or more:
o   By county and county equivalent:
·        Falls Church City, Va., and Lincoln County, S.D., had among the lowest poverty rates for counties and county equivalents.
·        Oglala Lakota County and Todd County in South Dakota, Holmes County, Miss., and McCreary County, Ky., had among the highest poverty rates.
o   By metropolitan statistical area:
·        Among all metropolitan areas, Fairbanks, Alaska, California-Lexington Park, Md., Midland, Texas, and Barnstable Town, Mass., had among the lowest poverty rates.
·        Brownsville-Harlingen, McAllen-Edinburg-Mission and Laredo, Texas, had among the highest poverty rates.
o   By micropolitan areas:
·        Los Alamos, N.M., McPherson, Kan., and Dickinson, N.D., were among those with lower poverty rates.
·        aGallup, N.M., Cleveland, Miss., and Rio Grande City and Raymondville, Texas, were among those with higher poverty rates.
Also Released from the American Community Survey:
·       The five-year estimates feature “Comparison Profile” tables. These tables compare differences between the latest set of American Community Survey five-year estimates (2012-2016) and the most recent, nonoverlapping five-year estimates (2007-2011). The tables note statistically significant differences.
·       The Application Programming Interface updated with 2012-2016 American Community Survey five-year estimates statistics.
·       Guidance on making comparisons is available on our website.
New Data Exploration Platform with County-Level Geography Profiles
The U.S. Census Bureau is currently working to streamline online data dissemination to be more customer-driven and user-friendly by creating one centralized and standardized platform to underlie the search on census.govIn addition to being available through the American FactFinder, some of the 2012-2016 American Community Survey five-year estimates will be released through the new platform, which is currently a preview site at data.census.gov. Specific products available include detailed tables, data profiles, subject tables and comparison profiles.
New for this release, data.census.gov is featuring county-level geography profiles, which provide data users a high-level overview of each of the 3,144 counties in a visual format with maps, charts and graphs. These profiles include 2012-2016 American Community Survey five-year estimates data on a variety of topics including income, commuting, home ownership and veterans, as well as business and industry data from the 2012 Economic Census, 2012 County Business Patterns and 2015 Survey of Business Owners.
We encourage you to take a look at data.census.gov and provide your thoughts on our work in progress at cedsci.feedback@census.gov. 
About the American Community Survey
The American Community Survey is the only source of small area statistics for social, economic, housing and demographic characteristics. It gives communities the current information they need to plan investments and services. Retailers, homebuilders, police departments, and town and city planners are among the many private- and public-sector decision-makers who count on these annual results. Visit the Stats in Action Videos page to see examples. These statistics would not be possible without the participation of the randomly selected households in the survey.
Because it is a survey based on a sample of the population rather than the entire population, the American Community Survey produces estimates. To aid data users, the Census Bureau calculates and publishes a margin of error for every estimate. For guidance on making comparisons, please visit census.gov.
Citation Guidance
When sourcing this data, please use “2012-2016 American Community Survey 5-year estimates.”

Monday, December 4, 2017

Administration Delays Decision On Race, Ethnicity Data For Census

From National Public Radio:

A major decision on the way the U.S. government collects information about race and ethnicity through the census and other surveys was expected to be announced last week by the Trump administration.

But the White House's Office of Management and Budget, which sets standards for this type of data for all federal agencies, was silent on Friday, which OMB had said was the deadline for an announcement.

A spokesperson for OMB could not provide any information about the delay.

Under consideration by the White House are proposals introduced during the Obama administration that would fundamentally change how the government counts the Latino population. Another proposal would create a new checkbox on census forms and other federal surveys for people with roots in the Middle East or North Africa. If approved, the policy changes could have significant implications on the upcoming 2020 census, as well as legislative redistricting, civil rights laws and health statistics.

"[The delay] tells me the new administration has taken an interest in the possible changes ... and wants to way weigh in," says Terri Ann Lowenthal, a former staff director of the House oversight subcommittee for the census who now consults on census issues.

Friday, November 17, 2017

More Children Live With Just Their Fathers Than a Decade Ago

America Families and Living Arrangements
Over One-Quarter of Children Under Age 18 Live With One Parent
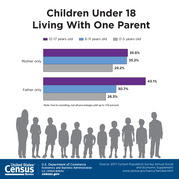
The percentage of children living with one parent who live with just their father saw an increase from 12.5 percent in 2007 to 16.1 percent in 2017. That’s according to new statistics from the U.S. Census Bureau’s 2017 America’s Families and Living Arrangements table package.
“A higher percentage of children living with one parent live with their fathers than a decade ago,” said Rose Kreider, a demographer in the Fertility and Family Statistics Branch at the Census Bureau. “However, the majority of children living with one parent still live with their mothers.”
In 2017, 83.9 percent of children living with one parent live with their mothers, compared to 86.0 percent in 2012 and 87.5 percent in 2007.
Overall, nearly 20 million children under age 18 live with one parent, composing 27.1 percent of all living arrangements for children under age 18. In 2007, 25.8 percent of children under age 18 lived with one parent, and in 2012, one of the highest intervening years, 28.3 percent of children under age 18 lived with one parent.
Of children who live with one parent, the most common marital status of the mother is never married (49 percent). The most common marital status of the father is divorced (43 percent). For children who live with their mother only, the largest proportions are ages 6 to 11 (36 percent), and ages 12 to 17 (35 percent). For children who live with their father only, the largest proportions are ages 12 to 17 (43 percent), followed by the proportion ages 6 to 11 (31 percent).
“The age distribution of children under age 18 who live with one parent shows a higher proportion of children living with their mother only are younger than children living with their father only,” Kreider said. 
There continues to be racial and ethnic variation in living arrangements for children under age 18. Today, over half (52.8 percent) of black alone children live with one parent, compared to 29.1 percent of Hispanic children and 22.4 percent of white alone children.
Other highlights:
Households
· White householders make up 79 percent of all households in the United States, down from 89 percent in 1970. Black and Hispanic householders each make up 13 percent of households, while Asian householders comprise 5 percent. (Hispanics may be any race so percentages will not add to 100.)
· Households have grown smaller over time, reflecting the decrease in family size and the rise of living alone. The average number of people living in each household has declined from 3.7 people in 1940 to 2.5 today.
· In 2017, there are 35.3 million single-person households, composing 28 percent of all households. In 1960, single-person households represented only 13 percent of all households.
· Today less than 1 in 10 households (9 percent) have five or more people living in them – a decrease from 23 percent of households in 1960.
Marriage and Family
· In 2017, the median age when adults first marry is 29.5 for men and 27.4 for women, up from ages 23.7 and 20.5, respectively, in 1947. In 2017, less than one-third of all adults (32 percent) have never been married, up from 23 percent in 1950.
· More men (35 percent) than women (29 percent) have never been married in 2017 compared to 26 percent of men and 20 percent of women in 1950.
· Married couples make up 69 percent of all families with children under age 18, compared to 93 percent in 1950.
· In 19 percent of married-couple households, neither the husband nor wife is in the labor force. Among married-couple households with neither spouse in the labor force, 75 percent are age 65 and older.
· Over a quarter (26 percent) of children under the age of 15 who live in married-couple families have a stay at home mother, compared to only 1 percent who have a stay at home father.
Living Arrangements of Adults and Children
· Over half (55 percent) of young adults ages 18 to 24 live in the parental home, compared to 16 percent of young adults ages 25 to 34.
· Of the 64 million parents living with children under the age of 18, 4.9 million (8 percent) are unmarried cohabiting parents.
· Most adults between the ages of 65 to 74 still live with a spouse. For men in this age group, 72 percent live with a spouse, while for women the percentage is 56 percent. For adults age 75 and older, however, the percentage of those living with a spouse drops to 66 percent for men and just 33 percent for women.
Unmarried Couples
· In 2017, there are 7.8 million unmarried opposite-sex couples living together.
· Of the unmarried opposite-sex couples living together, 37 percent live with children under the age of 18.
· Statistics about same-sex couples are available from the American Community Survey.

These statistics come from the 2017 Current Population Survey Annual Social and Economic Supplement, which has collected statistics on families for more than 60 years. The data shows characteristics of households, living arrangements, married and unmarried couples, and children.
For more information, see Families and Living Arrangements or visit census.gov.

Tuesday, May 9, 2017

Census Director Quits Just As The Census Ramps Up

From the Huffington Post:

The director of the U.S. Census Bureau is resigning, the Commerce Department announced Tuesday, leaving the government’s lead statistical agency without a clear leader as the bureau ramps up for the massive decennial task of counting the entire U.S. population in 2020.

Census Bureau Director John Thompson’s announcement that he is leaving at the end of June comes less than a week after he testified on Capitol Hill, telling House appropriators that his agency would be able to carry out the Census effectively, despite a number of cost overruns and a lower budget than normal for this point in the 10-year planning cycle.

Normally as Census planning shifts from the seventh year of the decade to the eighth, the budget jumps dramatically. But Congress did not pass the Obama administration’s budget for 2017, leaving the bureau about $160 million short of its $1.61 billion request.

Wednesday, April 19, 2017

The Changing Economics and Demographics of Young Adulthood From 1975 to 2016


Young Adults

Today’s young adults look different from prior generations in almost every regard: how much education they have, their work experiences, when they start a family and even who they live with while growing up. A new U.S. Census Bureau report, The Changing Economics and Demographics of Young Adulthood: 1975–2016, looks at changes in young adulthood over the last 40 years. The report focuses on the education, economics and living arrangements of today's young adults and how their experiences differ in timing and degree from what young adults experienced in the 1970s.
Highlights: 
·       Most of today’s Americans believe that educational and economic accomplishments are extremely important milestones of adulthood. In contrast, marriage and parenthood rank low: over half of Americans believe that marrying and having children are not very important in order to become an adult.
·       Young people are delaying marriage, but most still eventually tie the knot. In the 1970s, 8 in 10 people married by the time they turned 30. Today, not until the age of 45 have 8 in 10 people married.
·       More young people today live in their parents’ home than in any other arrangement: 1 in 3 young people, or about 24 million 18- to 34-year olds, lived in their parents’ home in 2015.
·       In 2005, the majority of young adults lived independently in their own household, which was the predominant living arrangement in 35 states. A decade later, by 2015, the number of states where the majority of young people lived independently fell to just six. Of the top five states where the most young adults lived independently in 2015, all were in Midwest and Plains states.
·       More young men are falling to the bottom of the income ladder. In 1975, 25 percent of young men ages 25 to 34 had incomes of less than $30,000 per year. By 2016, that share rose to 41 percent of young men (incomes for both years are in 2015 dollars).
·       Between 1975 and 2016, the share of young women who were homemakers fell from 43 percent to 14 percent of all women ages 25 to 34.
·       Of young people living in their parents’ home, 1 in 4 are idle, that is they neither go to school nor work. This figure represents about 2.2 million 25- to 34-year-olds. Among other characteristics, these young adults are more likely to have a child, so they may be caring for family, and over one quarter have a disability of some kind.
This report uses data from the Census Bureau’s American Community Survey and Current Population Survey to look at the changing demographics and economic characteristics of young adults. A third data source, the National Science Foundation’s General Social Survey, looks at beliefs, attitudes and values that Americans have about adulthood.

Friday, March 10, 2017

Women-Owned Business Help from the Small Business Administration

SBA Resources for Women

  • SBA’s Office of Women’s Business Ownership

    The Office of Women’s Business Ownership is here to answer your questions on the Women’s Business Center program or other services for women. Learn More
  • SBA Loans

    SBA offers a variety of loan programs for specific purposes—see which programs you qualify for. Learn More
  • SBA’s Women’s Business Centers

    SBA’s national network of over 100 educational centers assist women in starting and growing small businesses. Find One Near You
  • SBA’s Women-Owned Federal Contracting Program

    The WOSB Federal Contract Program levels the playing field for women competing for federal contracting opportunities. Learn More
On-line training curriculum: DreamBuilder
Through a strategic alliance with Thunderbird School of Global Management, SBA is pleased to provide access to the DreamBuilder online training curriculum in both English and Spanish.

Cutting Spending on Statistics Won’t Save the Budget

From PacificStandard:

Last week, the Trump administration announced it would seek dramatic spending cuts across a number of agencies in order to pay for a $54 billion increase in defense spending. That will be tough to accomplish: The bulk of the federal government’s budget goes to Social Security, Medicare, and defense spending, all of which the president has vowed to leave untouched. The administration has specifically said it would target the Environmental Protection Agency and “foreign aid,” both of which constitute a very small proportion of the federal budget. But elsewhere in Washington, D.C., researchers are worried that another category of government spending is also vulnerable: spending on statistics and data.

Donald Trump’s hostility toward official economic data is especially well-known. His casual comments about the official unemployment rate being “phony” have pained economists for months, and researchers have worried that the administration might seek to either stop collecting necessary data altogether, or might direct agencies to skew data in a manner that supports certain policies or claims. Last month, the Wall Street Journal reported that the administration was already floating the idea of changing the way the government calculates trade deficits, with a revised methodology that would make trade gaps look bigger—a change that would presumably bolster support for Trump’s assertion that the country’s trade policies and agreements need to be renegotiated or changed.

Thursday, March 9, 2017

The Geography of Foreign Students in U.S. Higher Education: Origins and Destinations

From Brookings

This report uses a new database on foreign student visa approvals from 2001 to 2012 to analyze their distribution in the United States, finding that:

The number of foreign students on F-1 visas in U.S. colleges and universities grew dramatically from 110,000 in 2001 to 524,000 in 2012. The sharpest increases occurred among students from emerging economies such as China and Saudi Arabia. Foreigners studying for bachelor’s and master’s degrees and English language training accounted for most of the overall growth.

Foreign students are concentrated in U.S. metropolitan areas. From 2008 to 2012, 85 percent of foreign students pursuing a bachelor’s degree or above attended colleges and universities in 118 metro areas that collectively accounted for 73 percent of U.S. higher education students. They contributed approximately $21.8 billion in tuition and $12.8 billion in other spending—representing a major services export—to those metropolitan economies over the five-year period.

Most foreign students come from large fast-growing cities in emerging markets. Ninety-four (94) foreign cities together accounted for more than half of all students on an F-1 visa between 2008 and 2012. Seoul, Beijing, Shanghai, Hyderabad and Riyadh are the five foreign cities that sent the most higher education students to the United States during that time.

Foreign students disproportionately study STEM and business fields. Two-thirds of foreign students pursuing a bachelor’s or higher degree are in science, technology, engineering, mathematics (STEM) or business, management and marketing fields, versus 48 percent of students in the United States. Both large (San Jose, Calif.) and small (Beaumont-Port Arthur, Texas) metro areas figure among those with the highest shares of their foreign students in STEM disciplines.

Forty-five (45) percent of foreign student graduates extend their visas to work in the same metropolitan area as their college or university. Metro areas that retain high shares of their foreign graduates under the temporary Optional Practical Training (OPT) program tend to be either large diversified economies (e.g., New York, Los Angeles), or specialized labor markets that align closely with foreign graduates’ training (e.g., Honolulu, Seattle, Las Vegas).

These findings suggest that foreign students can provide important economic benefits to their U.S. metropolitan destinations—serving as bridges back to their growing home cities and offering valuable skills to local employers. More metropolitan leaders should emulate leading practices that capitalize on the knowledge and relationships of foreign students to strengthen local economies while also maximizing students’ educational and professional experiences in the United States.

CHECK OUT the interactive data.

Wednesday, March 8, 2017

My Poetic Side: Women's History Month

Here is My Poetic Side's latest article celebrating Women's History Month. They made a vertical timeline with poets starting in the 18th century reaching all the way to the 21st, highlighting their most interesting facts and accomplishments to encourage and inspire other female poets to follow their lead.

The article is called "9 Poets to Remember during Women's History Month" (http://mypoeticside.com/featured/9-poets-to-remember), and it's also important to say that it features authors that don't usually have the spotlight on their career, so there's probably at least one writer you'll meet for the very first time.

Tuesday, March 7, 2017

2017 Alzheimer's Disease Facts and Figures

From the Alzheimer's Association:

Here are several critical statistics you'll find in Alzheimer's Association Facts and Figures:

Between 2000 and 2014, there was an 89 percent increase in deaths due to Alzheimer's. Deaths from Alzheimer's, the sixth-leading cause of death in the United States, nearly doubled during this period, while those from heart disease have declined.

More than 15 million Americans provide unpaid care for people with Alzheimer's or other dementias. In 2016, these caregivers provided an estimated 18.2 billion hours of care valued at over $230 billion.

2017 marks the first time total payments for caring for individuals with Alzheimer's or other dementias will surpass a quarter of a trillion dollars.

The information in this report is heartbreaking, but it's also a call to action for all who share our vision of a world without Alzheimer's disease.