|
Showing posts with label colleges. Show all posts
Showing posts with label colleges. Show all posts
Wednesday, November 30, 2016
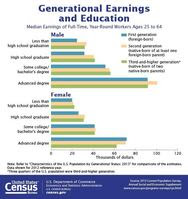
Children of Foreign-Born Parents More Likely to Be College-Educated Than Their Parents

Thursday, August 13, 2015
Is College Worth the Expense?
The cost of attending a four-year college in the United States has increased sharply of late, from around $3,500 in the early 1980’s to around $24,000 for this upcoming academic year.
Since 1980, nothing has increased in price more than college. Not health care. Not gasoline. Not housing.
If college costs had increased with inflation since the early 1980’s, tuition this year would be a little more than $9,000 per year. What accounts for the extra $15,000 in annual expenses?
More from AIER
Since 1980, nothing has increased in price more than college. Not health care. Not gasoline. Not housing.
If college costs had increased with inflation since the early 1980’s, tuition this year would be a little more than $9,000 per year. What accounts for the extra $15,000 in annual expenses?
More from AIER
Friday, October 10, 2014
A Silent Majority Of Undereducated And Underemployed Millennials
Millennials are often mocked as Starbucks baristas with Ivy League educations.
And while they are the best-educated generation to date, data from the Pew Research Center show about two-thirds of millennials between ages 25 and 32 lack a bachelor's degree.
That majority is often ignored in conversations about millennials.
This narrative is alive and well in Boston's Harvard Square, where church bells chime as millennials sip lattes and drift out of bookstores. But take a walk down the road, and the story changes.
More from NPR.
And while they are the best-educated generation to date, data from the Pew Research Center show about two-thirds of millennials between ages 25 and 32 lack a bachelor's degree.
That majority is often ignored in conversations about millennials.
This narrative is alive and well in Boston's Harvard Square, where church bells chime as millennials sip lattes and drift out of bookstores. But take a walk down the road, and the story changes.
More from NPR.
Wednesday, September 24, 2014
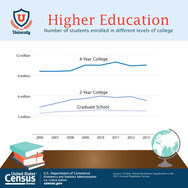
College Enrollment Declines for Second Year in a Row
|
Tuesday, September 9, 2014
Chancellor Nancy L. Zimpher Congratulates SUNY Campuses on U.S. News Rankings
“SUNY
colleges and universities offer students top quality degree programs, applied
learning opportunities, and workforce training that prepare them for success
and position New York State as a leader in the 21st-century global
economy.
“Today’s
favorable rankings by U.S. News & World Report are another testament
to SUNY’s capacity to deliver on our promises of access, completion, and
success as we offer one of the best values in higher education anywhere in the
country.
“Congratulations
to the many SUNY campuses recognized by the 2015
U.S. News and World Report rankings.”
Friday, July 18, 2014
New college data give fuller picture of graduation rates — and show challenges
From the Washington Post:

Dozens of public universities across the country..., report that fewer than half of their full-time freshmen in 2007 earned bachelor’s degrees after six years at those schools or after switching to other schools.
That finding emerges from an unusual cache of data posted on a nongovernmental Web site to provide what sponsors call “a more comprehensive and accurate picture” of college outcomes than can be found in federal records. The new data put a rare spotlight on a crucial group: transfer students.
The government tracks graduation rates for first-time, full-time students who finish where they began. But that omits the huge number who hop from school to school. Colleges are now stepping forward to fill in gaps in public knowledge through a site called Student Achievement Measure.
So far, 250 public colleges and 16 private schools have disclosed details about outcomes for the class that entered in fall 2007, including the proportions that:
●Graduated from their original school within six years.
●Graduated from other schools.
●Were still enrolled in quest of degrees.
●Had dropped out or were for some other reason untrackable.
These questions matter because every college student who fails to finish has invested a significant amount of money and effort — possibly going into debt — without reaping any of the economic or social benefits of obtaining a degree. Students of modest means, whose parents never went to college, are often those who face the highest hurdles in the effort to graduate.
This chart shows data for 266 colleges and universities, tracking outcomes for first-time, full-time students who entered college in 2007. See the chart.
Saturday, March 1, 2014
TOP-RANKED PUBLIC UNIVERSITIES WITH THE BEST ROI: NORTHEASTERN U.S. REGION
The northeastern region is home to many of the nation’s top public universities. This list ranks the top public universities in each state in the northeastern region by their 30 year net return on investment (ROI). The schools are listed in order of lowest to highest 30 yr net ROI for in-state students.
The criteria for inclusion in the list was that each school must be the top ranked school in its state according to U.S. News and World Report.
The purpose of this list is to allow students to compare and contrast the average 30 year net ROI of the top public university in each state for in-state and out-of-state students.
See the list, and the #1 from NYS, from BestValueSchools.
The criteria for inclusion in the list was that each school must be the top ranked school in its state according to U.S. News and World Report.
The purpose of this list is to allow students to compare and contrast the average 30 year net ROI of the top public university in each state for in-state and out-of-state students.
See the list, and the #1 from NYS, from BestValueSchools.
Monday, September 9, 2013
Hispanic college enrollment rate surpasses that of whites
A new U.S. Census Bureau report shows that after several years of gains, college enrollments in the U.S. fell between 2011 and 2012. But for one group—Hispanics—college enrollments were up, reflecting Hispanic population growth along with a growing share of young Latinos prepared for college. The new Census Bureau data also shows Hispanic students reached other milestones in 2012, continuing recent upward trends in educational attainment and college attendance.
For the first time, a greater share of Hispanic recent high school graduates are enrolled in college than whites. College enrollment rates among 18- to 24-year old Hispanics who had completed high school continued their upward march in 2012. According to the Census Bureau, 49% of young Hispanic high school graduates were enrolled in college. By comparison, 47% of white non-Hispanic high school graduates were enrolled in college. These findings reflect those of a May Pew Research Center report that showed the share of Hispanic high school graduates enrolled in college immediately after high school surpassed whites in 2012.
While the share of recent Hispanic high school graduates enrolled in college has surpassed that of whites, the same is not true among all young people ages 18 to 24. Because Hispanics have a higher high school dropout rate than whites, the share of all Hispanics ages 18 to 24 in college lags than of whites – 37.5% among Hispanics compared with 42.1% among whites.
For the first time, a greater share of Hispanic recent high school graduates are enrolled in college than whites. College enrollment rates among 18- to 24-year old Hispanics who had completed high school continued their upward march in 2012. According to the Census Bureau, 49% of young Hispanic high school graduates were enrolled in college. By comparison, 47% of white non-Hispanic high school graduates were enrolled in college. These findings reflect those of a May Pew Research Center report that showed the share of Hispanic high school graduates enrolled in college immediately after high school surpassed whites in 2012.
While the share of recent Hispanic high school graduates enrolled in college has surpassed that of whites, the same is not true among all young people ages 18 to 24. Because Hispanics have a higher high school dropout rate than whites, the share of all Hispanics ages 18 to 24 in college lags than of whites – 37.5% among Hispanics compared with 42.1% among whites.
Tuesday, September 3, 2013
After a Recent Upswing, College Enrollment Declines
According to U.S. Census Bureau statistics released today, college enrollment in fall 2012 plunged by half a million (467,000) from one year earlier. This decline, which includes both graduate and undergraduate enrollment, follows a period of substantial growth ─ 3.2 million ─ between 2006 and 2011.
These statistics come from School Enrollment: 2012. As the nation’s students begin a new school year, the Census Bureau releases its annual set of tables on the characteristics of children and adults enrolled in school at all levels ─ from nursery to graduate school. Among the characteristics examined are age, sex, race, Hispanic origin, nativity and foreign-born parentage.
This decline in college enrollment was driven by older students ─ that is, those 25 and older. Their enrollment fell by 419,000, while the enrollment of younger students declined by 48,000.
Hispanics didn’t follow the trend, as the number enrolled in college grew by 447,000 from 2011 to 2012. Meanwhile, non-Hispanic white enrollment declined by 1.1 million and black enrollment by 108,000. From 2006 to 2012, the percentage of all college students who were Hispanic rose from 11 percent to 17 percent. The percentage who were black also rose (from 14 percent to 15 percent), but the percent of non-Hispanic white students declined from 67 percent to 58 percent.
“This increase in the number of Hispanics enrolled in college can be attributed to the combination of an increase in the adult Hispanic population and their climbing likelihood of being enrolled,” said Julie Siebens, a statistician in the Census Bureau’s Education and Social Stratification Branch.
The tables released today cover specific topics such as enrollment by grade, the attendance status of nursery school students and characteristics of their mothers, the type of school college students attend (two-year, four-year, etc.) and whether they attend full or part time, students taking vocational courses and the enrollment status of recent high school graduates. The information was collected in the October 2012 Current Population Survey.
Also released today was School Enrollment in the United States: 2011, a report that examines the characteristics of people enrolled in school at all levels using statistics from the Current Population Survey, American Community Survey and federal sources outside the Census Bureau. It covers some topics not typically covered in Census Bureau reports, such as Head Start, charter schools, home schooling and receipt of financial aid.
Although most of the statistics are national-level, some state-level data from the American Community Survey are presented. Updated 2012 American Community Survey statistics on school enrollment covering states and all geographic areas with populations of 65,000 or more will be published in September.
Other national highlights from the 2012 Current Population Survey tables:
--In 2012, 78 million people, or 26.4 percent of the population 3 or older, were enrolled in school.
--In 2012, there were 19.9 million college students, including 5.8 million enrolled in two-year colleges, 10.3 million in four-year colleges and 3.8 million in graduate school.
--In 2012, there were 4.2 million students enrolled in private elementary and high schools (first through 12th grade), down from 4.8 million in 2005.
--Non-Hispanic white children in 2012 comprised 53 percent of elementary school students, down from 58 percent in 2005. Hispanic children made up 24 percent of elementary students in 2012, up from 20 percent in 2005. Black children comprised 15 percent of elementary students in 2012, down from 16 percent in 2005.
--Students who were born in another country or whose parents were foreign-born comprised 32 percent of all those enrolled in school at all levels in 2012.
--While most students are under 25, there were 804,000 students age 50 and older enrolled in schools at all levels in 2012.
These statistics come from School Enrollment: 2012. As the nation’s students begin a new school year, the Census Bureau releases its annual set of tables on the characteristics of children and adults enrolled in school at all levels ─ from nursery to graduate school. Among the characteristics examined are age, sex, race, Hispanic origin, nativity and foreign-born parentage.
This decline in college enrollment was driven by older students ─ that is, those 25 and older. Their enrollment fell by 419,000, while the enrollment of younger students declined by 48,000.
Hispanics didn’t follow the trend, as the number enrolled in college grew by 447,000 from 2011 to 2012. Meanwhile, non-Hispanic white enrollment declined by 1.1 million and black enrollment by 108,000. From 2006 to 2012, the percentage of all college students who were Hispanic rose from 11 percent to 17 percent. The percentage who were black also rose (from 14 percent to 15 percent), but the percent of non-Hispanic white students declined from 67 percent to 58 percent.
“This increase in the number of Hispanics enrolled in college can be attributed to the combination of an increase in the adult Hispanic population and their climbing likelihood of being enrolled,” said Julie Siebens, a statistician in the Census Bureau’s Education and Social Stratification Branch.
The tables released today cover specific topics such as enrollment by grade, the attendance status of nursery school students and characteristics of their mothers, the type of school college students attend (two-year, four-year, etc.) and whether they attend full or part time, students taking vocational courses and the enrollment status of recent high school graduates. The information was collected in the October 2012 Current Population Survey.
Also released today was School Enrollment in the United States: 2011, a report that examines the characteristics of people enrolled in school at all levels using statistics from the Current Population Survey, American Community Survey and federal sources outside the Census Bureau. It covers some topics not typically covered in Census Bureau reports, such as Head Start, charter schools, home schooling and receipt of financial aid.
Although most of the statistics are national-level, some state-level data from the American Community Survey are presented. Updated 2012 American Community Survey statistics on school enrollment covering states and all geographic areas with populations of 65,000 or more will be published in September.
Other national highlights from the 2012 Current Population Survey tables:
--In 2012, 78 million people, or 26.4 percent of the population 3 or older, were enrolled in school.
--In 2012, there were 19.9 million college students, including 5.8 million enrolled in two-year colleges, 10.3 million in four-year colleges and 3.8 million in graduate school.
--In 2012, there were 4.2 million students enrolled in private elementary and high schools (first through 12th grade), down from 4.8 million in 2005.
--Non-Hispanic white children in 2012 comprised 53 percent of elementary school students, down from 58 percent in 2005. Hispanic children made up 24 percent of elementary students in 2012, up from 20 percent in 2005. Black children comprised 15 percent of elementary students in 2012, down from 16 percent in 2005.
--Students who were born in another country or whose parents were foreign-born comprised 32 percent of all those enrolled in school at all levels in 2012.
--While most students are under 25, there were 804,000 students age 50 and older enrolled in schools at all levels in 2012.
Friday, August 23, 2013
Few Plan for College Expenses
Description from the New Strategist:
Only 43 percent of American families know how they will pay for college before their child enrolls in school, according to the latest Sallie Mae report, How America Pays for College 2013. The college cost "surprise" that greets many families as their child heads out the door is one factor behind the rise in student debt.
The typical family with an 18-to-24-year-old enrolled in an undergraduate program paid $21,178 for college in the 2012-13 school year. The funds came from a combination of parent income and savings ($5,727), loans ($5,760), grants and scholarships ($6,355), student income ($2,284), and gifts from relatives and friends ($1,053).
And in a similar vein, The One Comic That Explains Just How Screwed America Is.
Only 43 percent of American families know how they will pay for college before their child enrolls in school, according to the latest Sallie Mae report, How America Pays for College 2013. The college cost "surprise" that greets many families as their child heads out the door is one factor behind the rise in student debt.
The typical family with an 18-to-24-year-old enrolled in an undergraduate program paid $21,178 for college in the 2012-13 school year. The funds came from a combination of parent income and savings ($5,727), loans ($5,760), grants and scholarships ($6,355), student income ($2,284), and gifts from relatives and friends ($1,053).
And in a similar vein, The One Comic That Explains Just How Screwed America Is.
Friday, May 31, 2013
College majors, unemployment and earnings 2013
From the press release (georgetown.edu)
In the past, a college degree all but assured job seekers employment and high earnings, but today, what you make depends on what you take. In Hard Times 2013, we show differences in unemployment and earnings based on major for BA and graduate degree holders. We show that STEM — Science, Technology, Engineering, and Mathematics — majors typically offer the best opportunities for employment and earnings, while unemployment is higher for graduates with non-technical degrees.
Here are some of our major findings:
1. Even as the housing bubble seems to be dissipating, unemployment rates for recent architecture graduates have remained high (12.8%)...
2. Unemployment is generally higher for non-technical majors, such as the arts (9.8%) or law and public policy (9.2%).
3. People who make technology are still better off than people who use technology...
4. Unemployment rates are relatively low for recent graduates in education (5.0%), engineering (7.0%), health and the sciences (4.8%)...
In the past, a college degree all but assured job seekers employment and high earnings, but today, what you make depends on what you take. In Hard Times 2013, we show differences in unemployment and earnings based on major for BA and graduate degree holders. We show that STEM — Science, Technology, Engineering, and Mathematics — majors typically offer the best opportunities for employment and earnings, while unemployment is higher for graduates with non-technical degrees.
Here are some of our major findings:
1. Even as the housing bubble seems to be dissipating, unemployment rates for recent architecture graduates have remained high (12.8%)...
2. Unemployment is generally higher for non-technical majors, such as the arts (9.8%) or law and public policy (9.2%).
3. People who make technology are still better off than people who use technology...
4. Unemployment rates are relatively low for recent graduates in education (5.0%), engineering (7.0%), health and the sciences (4.8%)...
Thursday, April 18, 2013
College Enrollment and Work Activity of 2012 High School Graduates
In October 2012, 66.2 percent of 2012 high school graduates were enrolled in colleges or universities, the U.S. Bureau of Labor Statistics reported. Recent high school graduates not enrolled in college in October 2012 were more likely than enrolled graduates to be working or looking for work (69.6 percent compared with 38.2 percent)
More HERE.
More HERE.
Wednesday, March 13, 2013
Which state university grads earn the most?
From MoneyWatch:
Which of the nation's top state universities produce graduates who go on to make the biggest bucks?
Among all 50 state "flagship" schools, recent graduates of the University of California-Berkeley earn the highest median starting salary, at $53,100, according to CollegeMeasures.org. In comparison, new graduates at the University of South Dakota in the small town of Vermillion earn the least, at $35,900.
State flagship universities are typically the most prestigious public university in each of the 50 states. Such school typically attract higher performing students, receive greater financial support from their respective state governments and enjoy the best graduation rates among public institutions in their states.
Which of the nation's top state universities produce graduates who go on to make the biggest bucks?
Among all 50 state "flagship" schools, recent graduates of the University of California-Berkeley earn the highest median starting salary, at $53,100, according to CollegeMeasures.org. In comparison, new graduates at the University of South Dakota in the small town of Vermillion earn the least, at $35,900.
State flagship universities are typically the most prestigious public university in each of the 50 states. Such school typically attract higher performing students, receive greater financial support from their respective state governments and enjoy the best graduation rates among public institutions in their states.
Friday, January 4, 2013
First-Year Undergraduate Remedial Coursetaking
A primary goal of the U.S. Department of Education’s Elementary and Secondary Education Act (ESEA) Blueprint for Reform is to improve the college readiness of high school graduates. College readiness is a complex benchmark and has been measured in several ways, including transcript analysis and standardized test scores. One such measure, and the focus of this Statistics in Brief, is remedial coursework enrollment.
Consistent with earlier National Center for Education Statistics publications, this brief defines remedial courses as courses for students lacking skills necessary to perform college-level work at the degree of rigor required by the institution. At the start of their college careers, students who are not sufficiently prepared to complete entry-level courses are often encouraged or required to take developmental or remedial courses. Results from previous surveys conducted by the NCES that collected data on the percentage of students enrolled in remedial coursework found that 28 percent of first-year students who entered 2- or 4-year degree-granting postsecondary institutions were enrolled in remedial courses in both 1995 and 2000.
Consistent with earlier National Center for Education Statistics publications, this brief defines remedial courses as courses for students lacking skills necessary to perform college-level work at the degree of rigor required by the institution. At the start of their college careers, students who are not sufficiently prepared to complete entry-level courses are often encouraged or required to take developmental or remedial courses. Results from previous surveys conducted by the NCES that collected data on the percentage of students enrolled in remedial coursework found that 28 percent of first-year students who entered 2- or 4-year degree-granting postsecondary institutions were enrolled in remedial courses in both 1995 and 2000.
Monday, October 15, 2012
Choice of College Major Can Mean Millions Over Career
The field of bachelor’s degree makes a considerable difference in a college graduate’s annual earnings, according to 2011 American Community Survey (ACS) data released this month by the U.S. Census Bureau. These differences add up over the span of one’s work-life. For example, among people whose highest degree is a bachelor’s, engineering majors earn $1.6 million more than education majors.
These findings come from two separate ACS reports. The first report, Field of Degree and Earnings by Selected Employment Characteristics: 2011, provides information about the relationship between the field of bachelor’s degrees, median annual earnings, and the likelihood of full-time employment...
The second report, Work-Life Earnings by Field of Degree and Occupation for People With a Bachelor’s Degree: 2011, explores the relationship between how far one goes in school and how much money one might make over the course of a 40-year career (from age 25 to 64). It goes into further detail for people whose highest degree is a bachelor’s by investigating how college major and occupation impact these work-life earnings. This is the first time the Census Bureau has ever analyzed work-life earnings by both field of degree and occupation.
These findings come from two separate ACS reports. The first report, Field of Degree and Earnings by Selected Employment Characteristics: 2011, provides information about the relationship between the field of bachelor’s degrees, median annual earnings, and the likelihood of full-time employment...
The second report, Work-Life Earnings by Field of Degree and Occupation for People With a Bachelor’s Degree: 2011, explores the relationship between how far one goes in school and how much money one might make over the course of a 40-year career (from age 25 to 64). It goes into further detail for people whose highest degree is a bachelor’s by investigating how college major and occupation impact these work-life earnings. This is the first time the Census Bureau has ever analyzed work-life earnings by both field of degree and occupation.
Saturday, June 2, 2012
Metro areas with the Most College-Educated Residents
As another college graduation season draws to a close, the New York Times reports the results of a small analysis Brookings conducted on college degree attainment rates in metropolitan areas. They examined the share of adults age 25 and over in the 100 largest U.S. metro areas who held at least a bachelor’s degree in 2010, versus in 1970. (The Times’ website provides a table with the key data.)
NYC is #10, Albany/Schenectady/Troy is #20, Rochester is tied for #22.
NYC is #10, Albany/Schenectady/Troy is #20, Rochester is tied for #22.
Sunday, November 27, 2011
Student Debt and the Class of 2010
From the Institute for College Access & Success [PDF]
College seniors who graduated with student loans in 2010 owed an average of $25,250, up five percent from the previous year, according to a new report from the Project on Student Debt at the Institute for College Access & Success. The Class of 2010 also faced the highest unemployment levels for new college graduates in recent history: 9.1 percent.
College seniors who graduated with student loans in 2010 owed an average of $25,250, up five percent from the previous year, according to a new report from the Project on Student Debt at the Institute for College Access & Success. The Class of 2010 also faced the highest unemployment levels for new college graduates in recent history: 9.1 percent.
Wednesday, October 26, 2011
Trends in College Pricing 2011
Source: College Board
Increases in college prices for the 2011-12 academic year reflect the continued impact of a weakened economy as well as state funding that has not kept pace with the growth in college enrollments. For the fifth consecutive year, the percentage increase in average tuition and fees at public four-year colleges and universities was higher than the percentage increase at private nonprofit four-year colleges.
Full article
Increases in college prices for the 2011-12 academic year reflect the continued impact of a weakened economy as well as state funding that has not kept pace with the growth in college enrollments. For the fifth consecutive year, the percentage increase in average tuition and fees at public four-year colleges and universities was higher than the percentage increase at private nonprofit four-year colleges.
Full article
Monday, August 29, 2011
What 15 Financial Experts Want You to Know About College Expenses
There’s no shortage of information about college expenses: scholarships, loans, savings plans, the rising cost of college tuition, and more. Nearly everyone has advice for saving on or somehow managing to make college expenses work. But what do the experts have to say? We’ve found sound college advice from some of the top financial experts today, whether you’re wondering about 529s or raiding your retirement fund for college. Read on to find out what the experts know about saving and paying for college.
Monday, August 15, 2011
A Timeline of College Tuition
My wife went to college in the 1980s and recalled that she thought tuition at her private university was quite expensive. Since then, the tuition has increased fivefold, as we noticed on an alumni visit last week.
Speaking of which, A Timeline of College Tuition.
Speaking of which, A Timeline of College Tuition.
Subscribe to:
Posts (Atom)