Friday, March 10, 2017

Women-Owned Business Help from the Small Business Administration

SBA Resources for Women

  • SBA’s Office of Women’s Business Ownership

    The Office of Women’s Business Ownership is here to answer your questions on the Women’s Business Center program or other services for women. Learn More
  • SBA Loans

    SBA offers a variety of loan programs for specific purposes—see which programs you qualify for. Learn More
  • SBA’s Women’s Business Centers

    SBA’s national network of over 100 educational centers assist women in starting and growing small businesses. Find One Near You
  • SBA’s Women-Owned Federal Contracting Program

    The WOSB Federal Contract Program levels the playing field for women competing for federal contracting opportunities. Learn More
On-line training curriculum: DreamBuilder
Through a strategic alliance with Thunderbird School of Global Management, SBA is pleased to provide access to the DreamBuilder online training curriculum in both English and Spanish.

Cutting Spending on Statistics Won’t Save the Budget

From PacificStandard:

Last week, the Trump administration announced it would seek dramatic spending cuts across a number of agencies in order to pay for a $54 billion increase in defense spending. That will be tough to accomplish: The bulk of the federal government’s budget goes to Social Security, Medicare, and defense spending, all of which the president has vowed to leave untouched. The administration has specifically said it would target the Environmental Protection Agency and “foreign aid,” both of which constitute a very small proportion of the federal budget. But elsewhere in Washington, D.C., researchers are worried that another category of government spending is also vulnerable: spending on statistics and data.

Donald Trump’s hostility toward official economic data is especially well-known. His casual comments about the official unemployment rate being “phony” have pained economists for months, and researchers have worried that the administration might seek to either stop collecting necessary data altogether, or might direct agencies to skew data in a manner that supports certain policies or claims. Last month, the Wall Street Journal reported that the administration was already floating the idea of changing the way the government calculates trade deficits, with a revised methodology that would make trade gaps look bigger—a change that would presumably bolster support for Trump’s assertion that the country’s trade policies and agreements need to be renegotiated or changed.

Thursday, March 9, 2017

The Geography of Foreign Students in U.S. Higher Education: Origins and Destinations

From Brookings

This report uses a new database on foreign student visa approvals from 2001 to 2012 to analyze their distribution in the United States, finding that:

The number of foreign students on F-1 visas in U.S. colleges and universities grew dramatically from 110,000 in 2001 to 524,000 in 2012. The sharpest increases occurred among students from emerging economies such as China and Saudi Arabia. Foreigners studying for bachelor’s and master’s degrees and English language training accounted for most of the overall growth.

Foreign students are concentrated in U.S. metropolitan areas. From 2008 to 2012, 85 percent of foreign students pursuing a bachelor’s degree or above attended colleges and universities in 118 metro areas that collectively accounted for 73 percent of U.S. higher education students. They contributed approximately $21.8 billion in tuition and $12.8 billion in other spending—representing a major services export—to those metropolitan economies over the five-year period.

Most foreign students come from large fast-growing cities in emerging markets. Ninety-four (94) foreign cities together accounted for more than half of all students on an F-1 visa between 2008 and 2012. Seoul, Beijing, Shanghai, Hyderabad and Riyadh are the five foreign cities that sent the most higher education students to the United States during that time.

Foreign students disproportionately study STEM and business fields. Two-thirds of foreign students pursuing a bachelor’s or higher degree are in science, technology, engineering, mathematics (STEM) or business, management and marketing fields, versus 48 percent of students in the United States. Both large (San Jose, Calif.) and small (Beaumont-Port Arthur, Texas) metro areas figure among those with the highest shares of their foreign students in STEM disciplines.

Forty-five (45) percent of foreign student graduates extend their visas to work in the same metropolitan area as their college or university. Metro areas that retain high shares of their foreign graduates under the temporary Optional Practical Training (OPT) program tend to be either large diversified economies (e.g., New York, Los Angeles), or specialized labor markets that align closely with foreign graduates’ training (e.g., Honolulu, Seattle, Las Vegas).

These findings suggest that foreign students can provide important economic benefits to their U.S. metropolitan destinations—serving as bridges back to their growing home cities and offering valuable skills to local employers. More metropolitan leaders should emulate leading practices that capitalize on the knowledge and relationships of foreign students to strengthen local economies while also maximizing students’ educational and professional experiences in the United States.

CHECK OUT the interactive data.

Wednesday, March 8, 2017

My Poetic Side: Women's History Month

Here is My Poetic Side's latest article celebrating Women's History Month. They made a vertical timeline with poets starting in the 18th century reaching all the way to the 21st, highlighting their most interesting facts and accomplishments to encourage and inspire other female poets to follow their lead.

The article is called "9 Poets to Remember during Women's History Month" (http://mypoeticside.com/featured/9-poets-to-remember), and it's also important to say that it features authors that don't usually have the spotlight on their career, so there's probably at least one writer you'll meet for the very first time.

Tuesday, March 7, 2017

2017 Alzheimer's Disease Facts and Figures

From the Alzheimer's Association:

Here are several critical statistics you'll find in Alzheimer's Association Facts and Figures:

Between 2000 and 2014, there was an 89 percent increase in deaths due to Alzheimer's. Deaths from Alzheimer's, the sixth-leading cause of death in the United States, nearly doubled during this period, while those from heart disease have declined.

More than 15 million Americans provide unpaid care for people with Alzheimer's or other dementias. In 2016, these caregivers provided an estimated 18.2 billion hours of care valued at over $230 billion.

2017 marks the first time total payments for caring for individuals with Alzheimer's or other dementias will surpass a quarter of a trillion dollars.

The information in this report is heartbreaking, but it's also a call to action for all who share our vision of a world without Alzheimer's disease.

Friday, February 17, 2017

How Each Senator Voted on Trump’s Cabinet and Administration Nominees

From the New York Times

The Senate has confirmed each of President Trump’s nominees that it has voted on so far. Fifteen members of the cabinet and eight other top administration posts require Senate confirmation.

All but four of the “no” votes have come from Democrats and have essentially been symbolic statements of opposition. Nominees need only a simple majority to be confirmed, and Republicans hold 52 seats in the Senate.

We’ll continue to update this page as the Senate holds more confirmation votes.

[Pictured: Kirsten Gillibrand (D-NY), who has cast more NO votes than any other Senator.]

Thursday, February 16, 2017

Here’s the presidential order of succession

From the New York Daily News

For no specific reason, here’s a reminder of the order of succession if President Trump — and any of his immediate successors — were to somehow leave office very soon.

1. Vice President Mike Pence

2. House Speaker Paul Ryan

3. President pro tempore of the Senate Orrin Hatch (pictured)

4. Secretary of State Rex Tillerson

5. Treasury Secretary Steven Mnuchin

6. Defense Secretary James Mattis...

Friday, December 9, 2016

How to Avoid a Box Office Disaster

We use analytics to predict baseball, elections, and even pop music. But can an algorithm foretell a movie’s success or failure, even before it’s made?

In his seminal 1983 memoir, Adventures in the Screen Trade, screenwriter William Goldman disclosed what he believed to be “the single most important fact, perhaps, of the entire movie industry.” He wrote it in all caps, twice on the same page, one paragraph apart: "NOBODY KNOWS ANYTHING." Below, he narrowed “anything” down: "Nobody, nobody — not now, not ever — knows the least goddam thing about what is or isn’t going to work at the box office."

Goldman quotes a former studio executive, the ironically surnamed David Picker, as saying, "If I had said yes to all the projects I turned down, and no to all the ones I took, it would have worked out about the same." In Goldman’s experience, studio heads were no more effective than mutual-fund managers. Some had hot streaks, but none could keep beating the market. It wasn’t because they were bad at their jobs; it was because their jobs required the wisdom of crowds, not the wisdom of one person. "They’re trying to predict public taste three years ahead and it’s just not possible," Goldman wrote.

It’s hard enough to predict public taste in the present; even the Romans knew there was no accounting for it. Imagine trying to predict what the world will think of an unmade movie’s box office revenue, months before its first dailies. If you were facing that sort of uncertainty, you might want to rely less on the people operating on only feel — especially because, as Blumhouse president of feature films Couper Samuelson told my colleague Chris Ryan this week, "there are fewer and bigger movies being made," which means missing is more costly than ever.

Thursday, December 1, 2016

2015 HIV Surveillance Report

The Centers for Disease Control and Prevention’s (CDC) Division of HIV/AIDS Prevention published the 2015 HIV Surveillance Report. It is available online at https://www.cdc.gov/hiv/pdf/library/reports/surveillance/cdc-hiv-surveillance-report-2015-vol-27.pdf.

The HIV Surveillance Report, which CDC has published regularly since 1982, includes detailed information about diagnosed HIV infection in the United States and dependent areas. Together with supplemental reports and analyses published throughout the year, the report provides federal agencies, health departments, nonprofit organizations and other partners the data they need to monitor HIV infections, focus prevention efforts, and allocate resources.

This edition of the report marks an important departure from prior years, made possible by improvements in HIV surveillance methods and data sources. The report presents all diagnosis, death, and prevalence data without statistical adjustments for delays in reporting of cases to CDC. Such adjustments were long needed to compensate for reporting delays of data.

Today, however, reporting of case information is more timely; significantly less time is needed to identify duplicate cases from multiple states; and systems for national data processing have been substantially strengthened, enabling unadjusted data to provide a reliable assessment of the impact of diagnosed HIV infection.

Wednesday, November 30, 2016

Children of Foreign-Born Parents More Likely to Be College-Educated Than Their Parents


Population Characteristics
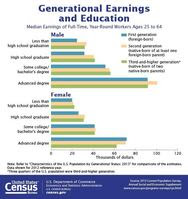
Native-born children of a foreign-born parent, also known as the second generation, were more likely to be college-educated and have higher incomes than their parents’ generation, according to a first-ever report from the U.S. Census Bureau. Additionally, this second-generation group surpasses education and income levels of the generations that follow them.
Characteristics of the U.S. Population by Generational Status: 2013 examines differences among the foreign-born or “first generation,” the second generation (native-born with at least one foreign-born parent) and the third-and-higher generation (native-born with two native-born parents) using data from the Current Population Survey. Three quarters of the U.S. population were third-and-higher generation, and the remaining quarter of the U.S. population was made up of approximately equal parts first and second generation.
“The expectation that one’s economic status will improve over one’s parents and grandparents is particularly salient in immigrant communities, in which the first generation often must work harder to overcome numerous cultural and economic challenges,” lead report author Edward Trevelyan said. “This report looks for evidence of such inter­generational mobility.”

Tuesday, November 29, 2016

IRS Data Book

The Internal Revenue Service (IRS) Data Book is published annually by the IRS and contains statistical tables and organizational information on a fiscal year basis. The report provides data on collecting the revenue, issuing refunds, enforcing the law, assisting the taxpayer, and the budget and workforce.

With a new online format, this year’s publication makes navigating data on taxpayer assistance, enforcement, and IRS operations easier, with graphic depictions of key areas and quick links to the underlying data. You can view selected summary graphs, key statistics, and descriptions of the tables and the IRS functions they cover.

Monday, November 28, 2016

Renters More Likely to Be Food Insecure Than Homeowners


***
About 10.5 million American households, or roughly 8.9 percent, reported that in the past month their access to adequate food was limited by a lack of money and other resources, according to new 2015 American Housing Survey statistics released today by the U.S. Department of Housing and Urban Development (HUD) and the U.S. Census Bureau.
For the first time in its 42-year history, the American Housing Survey included questions on food security status, which allowed HUD to assign households a “food security status” score. Using these categories, about 10.5 million occupied households were classified as having “low” or “very low” food security, which is commonly known as being “food insecure.”
The survey also looked at homeownership, race and having a disability in relation to food security. Results showed that 4.9 percent of homeowners and 15.5 percent of renters were food insecure, meaning they had “low” or “very low” food security.
 “For over 40 years, the American Housing Survey has been America’s premier source of statistics on housing costs and quality,” Katherine O’ Regan said, HUD’s Assistant Secretary for Policy Development and Research. “Working closely with experts at the U.S. Department of Agriculture, we added food insecurity to this survey to better understand the balance many lower income households face between the cost and quality of their housing and putting food on the table.” 
The Department of Housing and Urban Development in conjunction with the Department of Agriculture included the questions to determine whether the dietary quality or food consumption of household members was reduced or normal eating patterns were disrupted because the household lacked money for food any time during the last month. One adult respondent per household was asked questions about experiences and behaviors that indicate food insecurity, such as being unable to afford balanced meals, cutting the size of meals because of too little money for food, or being hungry because of too little money for food.
The American Housing Survey data is collected every other year by the Census Bureau and is the most comprehensive housing survey in the United States. It covers topics such as housing characteristics, housing costs, home improvements and neighborhood characteristics. In addition to food insecurity, the 2015 American Housing Survey includes three other new topics: the health and safety of homes, the use of housing counseling, and the importance of arts and culture. In addition to these topics, new questions explore the opinions of Americans on petty and major crime, satisfaction with schools, satisfaction with public transportation and risk for flooding or disasters.
Results showed that 16.9 percent of black householders, 19.5 percent of American Indian and Alaska Native householders, and 21.4 percent of Pacific Islander householders were food insecure, all significantly higher than that of white householders, at 7.5 percent.
About 16.6 percent of households with a person with a disability were food insecure, reporting “low” or “very low” food security, as opposed to 6.9 percent of households without a person with a disability.
In addition to the new survey topics, the American Housing Survey covers topics such as physical housing characteristics and financial characteristics. Below are highlights from the 2015 national and metropolitan statistical area level findings among the 118,290,000 occupied units. More information on 25 selected metropolitan areas will be available later this year.
Housing Costs
· The median cost for electricity was $104 per month (renters $82, owners $117), $53 per month for piped gas (renters $42, owners $58), and $133 per month for fuel oil (renters $100, owners $150).
· Median rent was $790 per month. This ranged from $250 for “other units,” such as boats, RVs or vans to $833 for single-unit, attached homes.
. The median monthly cost paid for water was $46 per month.
Financing a Home
· Of the 70.4 million households that purchased or built their homes, 13.2 percent had no down payment; 12.6 percent put 5 percent or less down; 12.9 percent had a down payment of 6 to 10 percent; 18.0 percent put 11 to 20 percent down, 15.2 percent put 21 percent or more down; and 8.4 percent bought the home outright. The rest did not report.
·Of owner-occupied units, 40.9 percent were owned free and clear, 53.6 percent had at least one regular or home-equity lump-sum mortgage only, and 5.0 percent had at least one home equity line of credit. The remainder had reverse mortgages.
·Most homeowners with a regular and/or home-equity mortgage had only one mortgage (95.0 percent), 5.0 percent had two mortgages and less than 1.0 percent had three or more.
· Well over a third, or 38.4 percent, of homeowners with a primary mortgage refinanced. While most, or 71.2 percent, refinanced for a lower interest rate (11.5 million homeowners), others did so to receive cash, 11.7 percent. The median amount of cash received from refinance was $28,000. The median percentage of that spent on home additions, improvements and repairs was 10.0.
Owner Home Improvement
· In a typical year, owners spent a median of $500 on routine maintenance or regular maintenance activities necessary for the preventive care of the structure, property and equipment. Such activities included painting, fixing leaks, repairing fences, cleaning gutters and removing dangerous trees.
· There were 43.9 million households, or 59.0 percent, that performed more than 123.5 million home improvement projects, other than routine maintenance, in the last two years, spending more than $431.1 billion, with a median of $1,200 per job.
· Around one third, or 33.6 percent, of owner-occupied units had at least one home improvement project in the last two years completed for energy efficiency purposes, 6.8 percent did at least one project to improve accessibility for an elderly person or a person with a disability, and 3.5 percent did at least one project to prepare the home for sale.
Neighborhood
· Householders of about 18.1 percent of all occupied housing units reported living near a body of water, and 14.4 percent of those reported that the unit was actually on waterfront property. In contrast, nearly 46.0 percent of all seasonal units were near a body of water, 53.5 percent of which were located on waterfront property.
·  Of the 59.8 million housing units in subdivisions (including multiunits and groups of mobile homes), 15.1 percent were located in secured communities with walls or fences, comprising 7.6 percent of all occupied units.
·  Of the 21.8 percent of all occupied housing units with a person age 55 or over, 11.3 percent were located in age-restricted communities. Of the remaining 88.7 percent, 24.4 percent said the majority of their neighbors are age 55 or over.

Wednesday, November 23, 2016

Eight Poets to Discuss Over the Thanksgiving Table

Thanksgiving is coming and My Poetic Side decided to provide some dinner talk with the "Eight Poets to Discuss Over the Thanksgiving Table" article.

Danielle Mohlman goes through eight outstanding contemporary poets, sharing some highlights and telling you why you should be reading them. Kate Tempest, Claudia Rankine, Patricia Lockwood and Tracy K. Smith are a few of the featured authors.

You can read the article at http://mypoeticside.com/featured/eight-poets-thanksgiving

Friday, November 11, 2016

Spotlight on War Poets

Since it is Veterans Day, My Poetic Side is shining a spotlight on some of their favorite war poets. There are seven featured authors, each related to a different war and ordered chronologically, from The American Civil War to the Iraq War.

You can read the full article HERE

Monday, October 31, 2016

Selected Characteristics of the Citizen Voting-Age Population

The U.S. Census Bureau released selected characteristics of the citizen voting-age population from the 2015 American Community Survey for all U.S. states and congressional districts.

These characteristics include selected age groups, sex, race, Hispanic origin, educational attainment, poverty status and household income.


Wednesday, October 26, 2016

Climate Change Indicators in the United States, 2016

The Earth's climate is changing. Temperatures are rising, snow and rainfall patterns are shifting, and more extreme climate events - like heavy rainstorms and record high temperatures - are already happening. Many of these observed changes are linked to the rising levels of carbon dioxide and other greenhouse gases in our atmosphere, caused by human activities.

EPA partners with more than 40 data contributors from various government agencies, academic institutions, and other organizations to compile a key set of indicators related to the causes and effects of climate change.'

This report presents 37 indicators, each describing trends related to the causes and effects of climate change. It focuses primarily on the United States, but in some cases, global trends are presented to provide context or a basis for comparison. The online version is updated periodically as new data become available.

Tuesday, October 4, 2016

Amazon Bans Most Users From Writing Reviews In Exchange For Free, Discounted Items

From The Consumerist

While Amazon has long looked down on reviews that were written in exchange for free or deeply discounted items, these write-ups were allowed so long as they followed the rules: The review must be honest, and the compensation must be fully disclosed. But... a number of compensated reviewers were gaming the system — posting hundreds of reviews a month, almost universally positive, and for products they sometimes couldn’t possibly have used. Now Amazon has announced a nearly full ban on compensated reviews.

There are a number of sites and social media groups that promote these free and discounted items, with the condition that the person receiving the product write an Amazon review within a given timeframe.

Yesterday, Chee Chew, Amazon’s VP of Customer Experience, explained the reason the company had previously tolerated these incentivized reviews is that they were seen as a way for little-known products to build up a base of customer feedback.

However... some reviewers were leaving very questionable reviews. For example, we found multiple reviews for a phone case for a Lumia 650 — all of them positive and many of them referencing how well the case fit onto their device. Problem was, that phone had not yet been released.

See also the story from GeekWire

Friday, September 30, 2016

It’s Time to Cancel Your Forgotten Internet Accounts

From the Wall Street Journal:

Yahoo Inc.’s revelation of a massive 2014 security breach might have reminded you of an old account or two you haven’t logged into for years.

No good comes from leaving details of your identity—alternate email addresses, date of birth and, yes, passwords—floating around the backwaters of the internet. Hackers who find their way into one account, dormant or still in use, can exploit details such as PINs or security-question answers to get into other accounts. That’s right, your old AOL Instant Messenger account could compromise your Facebook account.

It’s best to reduce your overall exposure. Think of it as a pruning exercise.

Before you start shuttering accounts, consider a few things. You might lose access to services you never knew were related. Your Yahoo account, for example, gets you into the popular photo site Flickr. Your Hotmail email address could be your login for Xbox Live, Office 365 or Skype.

Respect the finality of your decision—when you’re out, you’re out. But canceling isn’t always easy.

Monday, September 26, 2016

Corporate Crime Database

[As shared on the BUSLIB business librarian listserv]
Since the beginning of 2010, drug manufacturers, hospital systems, insurers and other healthcare companies have paid nearly $7 billion in fines and settlements to resolve cases in which they were accused of defrauding the federal government. Banks, led by Wells Fargo, account for the second largest portion of False Claims Act penalties, with more than $3 billion in payments. More than one-third of the 100 largest federal contractors have been defendants in such cases during the seven-year period.

These are some of the key findings that emerge from an expansion of Violation Tracker, a database of corporate crime and misconduct produced by the Corporate Research Project of Good Jobs First. It is available to the public for free at http://www.goodjobsfirst.org/violation-tracker.

With the addition of more than 750 cases relating to the 150-year-old False Claims Act and similar laws, Violation Tracker now contains a total of 112,000 entries from 30 federal regulatory agencies and all divisions of the Justice Department.