Showing posts with label manufacturing. Show all posts

Monday, December 18, 2017

2016 Annual Survey of Manufactures and other reports

The 2016 Annual Survey of Manufactures (ASM) release includes general statistics, value of products shipments, industry-product analysis and geographic area statistics for 2015 and 2016. The ASM provides data about manufacturing that are crucial to accurate estimates of domestic production and productivity and to making sound decisions on economic trade policies. Companies, business analysts and trade associations use this data in planning investments, production and marketing.
This report presents data at the two- through six-digit North American Industry Classification System (NAICS) levels on employment, payroll, cost of materials, operating expenses, shipments and receipts for services, value added, and inventories.
This report presents product shipment statistics at the six-digit NAICS level and seven-digit NAICS product class level.
Presents value of shipments, including miscellaneous receipts, at the six-digit NAICS level by three-digit product code levels.
These reports present manufacturing statistics by state at the two- through four-digit NAICS levels and supplemental statistics for the United States and states at the two-digit NAICS level.

Friday, December 18, 2015

Census Bureau Releases 2014 Annual Survey of Manufactures Data

The files show that the U.S. manufacturing sector’s $5.9 trillion in shipments in 2014 were up 1.2 percent, from $5.8 trillion in 2013. Shipments for Kansas climbed 7.1 percent, from $89.2 billion in 2013 to $95.5 billion in 2014.
State highlights include: 
·         Among states and equivalents, manufacturing shipments in 2014 ranged from $0.3 billion in the District of Columbia to $698.7 billion in Texas.

Friday, October 2, 2015

Manufacturing Day: Oct. 2

In recognition of this fourth annual observance, the Census Bureau joins a group of public and private organizations in celebrating the importance of the manufacturing sector of the nation’s economy. The economic census, the Census Bureau’s most comprehensive source of information on American businesses and the economy, began collecting statistics on the manufacturing sector in 1810. In addition to the economic census, the Census Bureau releases manufacturing statistics from a multitude of surveys, including the Annual Survey of Manufactures, multiple economic indicators, and the Survey of Business Owners, to name a few. Today, our manufacturing statistics help paint a picture of the U.S. economy and the role this sector plays in it. Among some of the web pages that serve as a gateway to these data are:
·          Manufacturing Day home page — The homepage offers an array of previously released and new data products relevant to Manufacturing Day. Featured among these products is the Industry Snapshot for Manufacturing and the recently released Manufacturing and International Trade Report. New content is also available, including an infographic with a five-year comparison of the top 10 manufacturing subsectors of the economy using statistics from the Economic Census Manufacturing Summary Series as well as a link to today’s Director’s blog. A comprehensive infographic with the most recent year’s data from several key programs tracking the nation’s manufacturing industries will be added as it becomes available. Internet address: <http://www.census.gov/topics/business/manufacturing/day.html>.
·          Profile America’s Stats for Stories: Manufacturing Day — Stats for Stories provides reporters and the public a one-stop shop for timely, relevant statistics and resources about observances not covered by the Facts for Features series. This edition includes links to manufacturing datasets from a variety of surveys, including but not limited to the Manufacturers’ Shipments, Inventories, and Orders; the Annual Survey of Manufactures; County Business Patterns; the Capital Spending Report; and multiple series from the economic census, including the Economic Census of Island Areas. Internet address: <http://www.census.gov/newsroom/stories/2015/october/manufacturing.html>.

Monday, August 31, 2015

The Manufacturing and International Trade Report

On August 28, 2015, the U.S. Census Bureau released the 2013 Manufacturing and International Trade Report (MITR). This report contains manufacturing data on the value of product shipments. The data are published on a North American Industry Classification System (NAICS) basis from the 2013 Annual Survey of Manufactures and  the 2012 Economic Census Subject Series. The MITR also includes official U.S. export and import merchandise trade statistics.
The MITR will provide a comprehensive comparison between detailed manufacturing product class data and associated import and export data for 2013 and 2012.

Tuesday, August 18, 2015

Subject and Summary Series tables for the Manufacturing Sector Have Been Released

The following Subject/Summary series tables, data from the 2012 Economic Census, were released today on American FactFinder:
The Subject/Summary series includes summary data by industry and other special topics. Data is available at the national level and, for selected tables, at the state, county, or place level. For more information, see the Economic Census Subject/Summary page.

Data will be released on a flow basis by sector by topic. To view a release schedule, see what has been released, or take a sneak peek at what’s projected to be released in the next 30 days, see the Economic Census website.

Monday, March 2, 2015

Annual Survey of Manufactures: 2013

National-level data for manufacturing industry groups and industries at the three-, four-, five- and six-digit North American Industry Classification System (NAICS) levels. Provides statistics on employment, payroll, supplemental labor costs, cost of materials consumed, operating expenses, value of shipments, value added by manufacturing, fuels and electric energy used, and inventories. 
Also provides statistics for each state and the District of Columbia as well as product shipments statistics at the seven-digit product class level. Survey statistics are released annually except for years ending in 2 and 7, at which time they are included in the manufacturing sector of the economic census. Internet address:

Friday, January 30, 2015

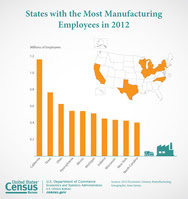
New York State ranks third in Manufacturing Employment for 2012


Manufacturing Employment
Los Angeles Alone Has More Than 100,000 Manufacturing Employees
The Census Bureau has released manufacturing statistics from its 2012 Economic Census at the state, metro area and county levels, as well as for cities and towns, for more than 350 manufacturing industries. These data, referred to as the Geographic Area Series, cover more than 296,000 U.S. manufacturing establishments (NAICS 31-33) within every state and their localities.
“These Geographic Area Series reports are the only source of detailed economic information for more than 15,000 cities, towns and other similar places in the U.S.,” Census Bureau Director John H. Thompson said. “We are pleased that over the course of this year, the Geographic Area Series will be providing for 18 sectors of the economy − economic information for the first time for more than 5,000 small towns. This unique data set is indispensable in assessing the performance of the economy in every corner of the country.”

Wednesday, December 31, 2014

The Manufacturing and International Trade Report

The U.S. Census Bureau has released the 2012 Manufacturing and International Trade Report (MITR). This new annual report contains manufacturing data on the value of product shipments. The data are published on a North American Industry Classification System (NAICS) basis from the 2012 Economic Census Industry Series. The MITR also includes official U.S. export and import merchandise trade statistics.

The MITR will, for the first time, provide a comprehensive comparison between detailed manufacturing product class data and associated import and export data.

Thursday, December 18, 2014

NEW: 2012 Manufacturing and International Trade Report

This new annual report from the U.S. Census Bureau will, for the first time, provide a comprehensive comparison between detailed manufacturing product class data and associated import and export data. The data are published on a North American Industry Classification System basis from the 2012 Economic Census Industry Series, presented with official U.S. export and import merchandise trade statistics. Future reports will also incorporate statistics from the Annual Survey of Manufactures. Go to: http://www.census.gov/foreign-trade/Press-Release/MITR/2012/.

Wednesday, October 1, 2014

Census Bureau Completes Release of All 364 Manufacturing Reports from Economic Census Industry Series


Manufacturing Day: Oct.3, 2014
In recognition of Manufacturing Day, the Census Bureau presents descriptions of its wide array of data products on the manufacturing sector of the economy. Additionally, statistics on all 364 industries in the manufacturing sector are now available from the 2012 Economic Census.
·         2012 Economic Census Industry Series: A complete series of national-level data files on specific manufacturing industries, including, for instance, the number of establishments, payroll, number of employees, value of product shipments and services provided by businesses. News releases are available highlighting breweriesautomobile manufacturing, household appliance manufacturing and semiconductor manufacturing. The economic census is conducted every five years.

Wednesday, February 20, 2013

Critical Materials: Present Danger to U.S. Manufacturing | RAND

By Richard Silberglitt, James T. Bartis, Brian G. Chow, David L. An, Kyle Brady

A high percentage of many raw and semi-finished materials critical to U.S. manufacturing are imported. China is the controlling producer of 11 of these materials and has instituted export restrictions that have led to two-tier pricing, creating pressure to move manufacturing to China. This report suggests the need for actions to mitigate the impact of such market distortions on the global manufacturing sector.

From RAND

Sunday, June 10, 2012

Using the New American Fact Finder, Version 1.1

American FactFinder (AFF) is the Census Bureau’s primary dissemination tool for many Census Bureau Programs, including:
Decennial Census
American Community Survey
Population Estimates
Economic Census of the United States
Economic Census of the Island Areas
Survey of Business Owners
Commodity Flow Survey
County & ZIP Code Business Patterns
Nonemployer Statistics
Annual Survey of Manufacturers

These programs listed above account for more than 60 datasets and publish data for over 12 million different geographies.
To accommodate this large amount of data, AFF follows a topic based approach. You build a search by selecting keywords and filters from different search menus. As you add additional keywords and filters, the search results become limited to only the tables that meet the criteria. Once you have refined the search results to a suitable level, you can either download or view one or more tables. The table(s) will display the data selected.

Thursday, September 1, 2011

Multifactor Productivity Trends in Manufacturing, 2009

From the Bureau of Labor Statistics [PDF]

Manufacturing sector multifactor productivity declined at a 5.7 percent annual rate in 2009, the U.S. Bureau of Labor Statistics reported. This was the largest annual decline in multifactor productivity since the series started in 1987. The multifactor productivity decline in 2009 reflected a 12.5 percent decrease in output and a 7.2 percent decrease in combined inputs.

Friday, November 19, 2010

Economic Indicator Search Tool

The Census Bureau has introduced a new, user-friendly Internet tool that takes all the guesswork out of finding, downloading and using data from economic indicators. For the first time, users can access data from multiple indicators in one place and all in the same format. This tool provides an easy way to create data tables in ASCII text or time series charts in your favorite spreadsheet format. Users can select an indicator and choose data by item, time period and other dimensions using drop-down menus. Of the Census Bureau's 12 economic indicators, four are operational in the new tool now — international trade, manufactures' shipments, monthly wholesale trade and quarterly services; the remainder are expected to be available in this database throughout the course of 2011. See also a blog on this tool.

Tuesday, September 28, 2010

Industrial College of the Armed Forces

The following student reports are based on fieldwork and core course studies that prepare graduates with analytic and historic perspectives on a variety of national resources and industry. Some 20 resource areas are the focus of inspection and provide a platform to think strategically about the needs of a nation. The reports are published annually. Copies may be downloaded from this website by clicking on the links in the industry study focus area.

The completed topics for 2010 include:
Agribusiness: All economic activity that supports farm production and the conversion of raw farm products to consumable goods.
Aircraft: All economic activity that supports the production of aircraft and subsidiary systems related to aircraft flight
Biotechnology: Activity that supports technological application using biological systems, living organisms, or derivatives, to make or modify products or processes for specific use.
Education: Activity that supports the process and systems of learning distributed to the individuals and to the nation at large.
Electronics: All economic activity that supports the production of components and systems that have the ability to control electron flow.
Energy: All activity that supports the production,distribution and use of materials that provide a fuel source for mechanisms to do work.
Environment: Study of activities,perspectives and behaviors which impact global resources and populations.
Health Care: All activity that supports the provision of services that impact or improve the well being of a population.
Information Technology: All economic activity that supports the production, distribution and systems that guide or direct data to users or clients.
Manufacturing: Study of the systems, processes and mechanisms used to assemble complex goods for sale or distribution in various marketplaces.
Privatized Military OPS: Economic activities of the private sector that support battlefield operations or services that maintain war fighter readiness.
Reconstruction and Vital Infrastructure: Activity that supports the development or redevelopment of structures that support national integrity and pathways to provide for the various needs of the population.
Shipbuilding: All economic activity that supports the production of vehicles designed to be used at sea for warfighting and other use.
Space: Study of systems, concepts and strategies that are related to using the area outside the physical boundary of the planet.
Strategic Materials: All economic activity that supports the production and conversion of common and rare earth materials for use in goods.
Transportation: All economic activity and systems that support the movement of goods from one area to another.

Friday, August 10, 2007

Manufacturing companies and their plant locations

From BUSLIB:

"Does anyone know of a directory or database of manufacturing companies and their plant locations? I don't need subsidiary or division locations. There are plenty of database for that. I need to be able to determine where a company's manufacturing plants are located."

REPLY #1: "Try searching the EPA envirofacts warehouse to find plant locations. This source obviously does not cover every company or facility but it is free and easy to use.

"For example enter General Motors in 'facility selection' and then scroll to the bottom to hit search, when the results come up click on 'view facility information' - you get some basic information plus a map of the location and the Duns number so you can run a D&B report or obtain additional information from a D&B database."

REPLY #2: "This is true and an excellent resource and at last count had more than 1.3 million US facilities. However, remember two points about this database:
1. The database is about 24 months out of date
2. Any facility listed must have EPA registered emissions or waste (air, water, hazmat, etc.). Gasoline stations are exempt; i.e. no emissions and the facility will not be listed.
However, most plant facilities have some kind of emissions. Even Keebler Cookie plants are listed.

Another good site to see a companies facilities with address is the searchable OSHA database.