From Governing
Those considered to be of prime working age are between the ages of 25 and 54.
In 2015, an estimated 128 million Americans fell into this age bracket. Over the past five years, Census estimates suggest many areas have experienced notable declines in the prime working age population even though overall numbers have increased slightly. In some places, aging of baby boomers accounts for the decline, while other regions are experiencing outmigration of their young and middle-aged adults.
See also Where the Working-Age Population Is Declining and Why It Matters
Tuesday, August 9, 2016
Monday, August 8, 2016
NYS Taxable Sales and Purchases by Geography and Industry Data
NYS Tax Department has posted the Taxable Sales and Purchases by Geography and Industry Data to Open Data through February 2016.
To view the data click HERE.
Friday, August 5, 2016
Australia: choose “no religion” rather than “Jedi”
From AmeriNZ
Australia is about to conduct its latest census, and the topic of religion has become an issue. The question for them is whether people should choose “no religion” as a designation...
The graphic at left is a plea from the Atheist Foundation of Australia to choose “no religion” rather than “Jedi”. They say that if people choose Jedi, it’s classified as a “Not Defined” religion instead of “No Religion,” and that matters because it makes Australia seem more religious than it actually is, and would encourage the government to give more money to religious-based organisations than they otherwise would.
At the moment, some 61.1% of Australians chose some sort of Christianity, and a mere 22.3% chose “no religion”.
The problem here is that “no religion” doesn’t necessarily mean literally no religion: It often simply means no particular religion...
Australia is about to conduct its latest census, and the topic of religion has become an issue. The question for them is whether people should choose “no religion” as a designation...
The graphic at left is a plea from the Atheist Foundation of Australia to choose “no religion” rather than “Jedi”. They say that if people choose Jedi, it’s classified as a “Not Defined” religion instead of “No Religion,” and that matters because it makes Australia seem more religious than it actually is, and would encourage the government to give more money to religious-based organisations than they otherwise would.
At the moment, some 61.1% of Australians chose some sort of Christianity, and a mere 22.3% chose “no religion”.
The problem here is that “no religion” doesn’t necessarily mean literally no religion: It often simply means no particular religion...
Wednesday, July 6, 2016
The Report of the Iraq Inquiry (UK)
The Report of the Iraq Inquiry was published on 6 July 2016.
From the links on the page you can access the Executive Summary and the Report, search the supporting documents and review transcripts and recordings of the original hearings.
From METRO: The 12-volume, 2.6 million-word report, which comes at a turbulent time in British politics... found that British military action was not the last resort and that policy on Iraq was made on the basis of flawed intelligence that was never challenged.
From the Independent:
Sir John Chilcot has published his long awaited report into the Iraq War.
The Iraq Inquiry has concluded the war was "unneccessary" as Saddam Hussein posed no immediate threat to the US or the UK.
Sir John said the secret intelligence reports "did not justify" former Prime Minister Tony Blair's belief in the presence of weapons of mass destruction (WMDs) but found that Mr Blair did sincerely believe they were there.
In direct contradiction to what Mr Blair told the inquiry, Sir John also found he and George W Bush were made aware that the country could descent into sectarian civil war after the invasion so "hindsight was not required".
See also RT.com
From the links on the page you can access the Executive Summary and the Report, search the supporting documents and review transcripts and recordings of the original hearings.
From METRO: The 12-volume, 2.6 million-word report, which comes at a turbulent time in British politics... found that British military action was not the last resort and that policy on Iraq was made on the basis of flawed intelligence that was never challenged.
From the Independent:
Sir John Chilcot has published his long awaited report into the Iraq War.
The Iraq Inquiry has concluded the war was "unneccessary" as Saddam Hussein posed no immediate threat to the US or the UK.
Sir John said the secret intelligence reports "did not justify" former Prime Minister Tony Blair's belief in the presence of weapons of mass destruction (WMDs) but found that Mr Blair did sincerely believe they were there.
In direct contradiction to what Mr Blair told the inquiry, Sir John also found he and George W Bush were made aware that the country could descent into sectarian civil war after the invasion so "hindsight was not required".
See also RT.com
Labels:
Chiclot report,
George W. Bush,
Iraq war,
Tony Blair
Saturday, July 2, 2016
The baffling reason many millennials don’t eat cereal
From the Washington Post:
Few things are as painless to prepare as cereal. Making it requires little more than pouring something (a cereal of your choice) into a bowl and then pouring something else (a milk of your choice) into the same bowl. Eating it requires little more than a spoon and your mouth. The food, which Americans still buy $10 billion of annually, has thrived over the decades, at least in part, because of this very quality: its convenience.
And yet, for today's youth, cereal isn't easy enough.
The New York Times published a story about the breakfast favorite, and the most disconcerting part was this:
Almost 40 percent of the millennials surveyed by Mintel for its 2015 report said cereal was an inconvenient breakfast choice because they had to clean up after eating it.
The industry, the piece explained, is struggling — sales have tumbled by almost 30 percent over the past 15 years, and the future remains uncertain. And the reasons are largely those one would expect: Many people are eating breakfast away from the home, choosing breakfast sandwiches and yogurt instead of more traditional morning staples. Many others, meanwhile, too busy to pay attention to their stomachs, are eating breakfast not at all.
Few things are as painless to prepare as cereal. Making it requires little more than pouring something (a cereal of your choice) into a bowl and then pouring something else (a milk of your choice) into the same bowl. Eating it requires little more than a spoon and your mouth. The food, which Americans still buy $10 billion of annually, has thrived over the decades, at least in part, because of this very quality: its convenience.
And yet, for today's youth, cereal isn't easy enough.
The New York Times published a story about the breakfast favorite, and the most disconcerting part was this:
Almost 40 percent of the millennials surveyed by Mintel for its 2015 report said cereal was an inconvenient breakfast choice because they had to clean up after eating it.
The industry, the piece explained, is struggling — sales have tumbled by almost 30 percent over the past 15 years, and the future remains uncertain. And the reasons are largely those one would expect: Many people are eating breakfast away from the home, choosing breakfast sandwiches and yogurt instead of more traditional morning staples. Many others, meanwhile, too busy to pay attention to their stomachs, are eating breakfast not at all.
Thursday, June 30, 2016
Proposed 2020 Census Residence Criteria and Residence Situations
A Proposed Rule by the Census Bureau on 06/30/2016
From the Federal Register:
he Bureau of the Census (U.S. Census Bureau) is providing notification and requesting comment on the proposed “2020 Census Residence Rule and Residence Situations.” In addition, this document contains a summary of comments received in response to the May 20, 2015, Federal Register document, as well as the Census Bureau's responses to those comments. The residence criteria are used to determine where people are counted during each decennial census. Specific residence situations are included with the criteria to illustrate how the criteria are applied.
The U.S. Census Bureau is committed to counting every person in the 2020 Census once, only once, and in the right place. The fundamental reason that the decennial census is conducted is to fulfill the Constitutional requirement (Article I, Section 2) to apportion the seats in the U.S. House of Representatives among the states. Thus, for a fair and equitable apportionment, it is crucial that the Census Bureau counts everyone in the right place during the decennial census.
The residence criteria are used to determine where people are counted during each decennial census. Specific residence situations are included with the criteria to illustrate how the criteria are applied.
1. The Concept of Usual Residence
From the Federal Register:
he Bureau of the Census (U.S. Census Bureau) is providing notification and requesting comment on the proposed “2020 Census Residence Rule and Residence Situations.” In addition, this document contains a summary of comments received in response to the May 20, 2015, Federal Register document, as well as the Census Bureau's responses to those comments. The residence criteria are used to determine where people are counted during each decennial census. Specific residence situations are included with the criteria to illustrate how the criteria are applied.
The U.S. Census Bureau is committed to counting every person in the 2020 Census once, only once, and in the right place. The fundamental reason that the decennial census is conducted is to fulfill the Constitutional requirement (Article I, Section 2) to apportion the seats in the U.S. House of Representatives among the states. Thus, for a fair and equitable apportionment, it is crucial that the Census Bureau counts everyone in the right place during the decennial census.
The residence criteria are used to determine where people are counted during each decennial census. Specific residence situations are included with the criteria to illustrate how the criteria are applied.
1. The Concept of Usual Residence
Monday, June 20, 2016
May 2016 Is the Eighth Temperature Record-Breaking Month in a Row
From Slate:
October. November. December. January. February. March. April. And now May.
For the sixth seventh eighth month in a row, we’ve had a month that has broken the global high temperature record. And not just broken it, but shattered it, blasting through it like the previous record wasn’t even there.
According to NASA’s Goddard Institute for Space Studies, March April May 2016 was the hottest March April May on record, going back 136 years. It was a staggering 1.28°C 1.11°C 0.93° C above average across the planet. The previousMarch April May record, from 2010 2014, was 0.92° 0.87° 0.86° above average. This year took a huge jump over that.
Welcome to the new normal, and our new world.
Thursday, June 9, 2016
New York Report Chronicles ACA Implementation Progress
With the overall national experience in the implementation of the Affordable Care Act (ACA) being uneven, often reflecting stark political divisions within states, the implementation of the ACA in New York State has been relatively smooth, according to the just released findings of researcher Sarah F. Liebschutz, a distinguished service professor emerita of the State University of New York (SUNY) and former chair of the political science department at SUNY Brockport.
Liebschutz's study is the latest in a series of more than 30 reports released through the efforts of the 40-state, 70-researcher ACA Implementation Network of the Rockefeller Institute of SUNY, the Brookings Institution and the Fels Institute of Government of the University of Pennsylvania.
According to the study, New York's success is attributable to the fact that "New York's leaders (executive and legislative) affirmed state options early and subsequently acted to improve access, quality, and cost savings. They were influenced by past experience and enhanced ACA implementation through partnerships with statewide, nonprofit organizations," the study concluded.
Liebschutz also discussed the significance of the addition of New York's Basic Health Plan (BHP) during the third open enrollment period. New York is now the nation's leading and largest BHP, an example of how New York's leaders used federal funds to take advantage of recent health system change opportunities.
Through the expansion of Medicaid eligibility and the establishment of the New York Health Benefit Exchange, known as the NY State of Health, the enrollment of insured New Yorkers increased by approximately 961,000 in the program's first year to more than 2.8 million in year three.
Thomas Gais, director of the Rockefeller Institute, commented on the report and the forum: "What I find impressive about New York's implementation of the ACA is its integration of several different programs ---- including Medicaid, Child Health Plus, the Qualified Health Plans, and the Essential Plan ---- into a wide-ranging yet accessible whole for New York residents seeking health care. The federal government may operate these as separate 'silos.' But New York has connected them for the sake of its people. That's federalism at its best."
Specifics of the New York implementation were discussed in a public event held at the Rockefeller Institute on June 6th.
To read the report, go to www.rockinst.org/ACA/states/New_York/2016-06-New_York_Individual_Report.pdf.
To view the video of the event, go to www.youtube.com/watch?v=OPxbYpjb94Q.
Liebschutz's study is the latest in a series of more than 30 reports released through the efforts of the 40-state, 70-researcher ACA Implementation Network of the Rockefeller Institute of SUNY, the Brookings Institution and the Fels Institute of Government of the University of Pennsylvania.
According to the study, New York's success is attributable to the fact that "New York's leaders (executive and legislative) affirmed state options early and subsequently acted to improve access, quality, and cost savings. They were influenced by past experience and enhanced ACA implementation through partnerships with statewide, nonprofit organizations," the study concluded.
Liebschutz also discussed the significance of the addition of New York's Basic Health Plan (BHP) during the third open enrollment period. New York is now the nation's leading and largest BHP, an example of how New York's leaders used federal funds to take advantage of recent health system change opportunities.
Through the expansion of Medicaid eligibility and the establishment of the New York Health Benefit Exchange, known as the NY State of Health, the enrollment of insured New Yorkers increased by approximately 961,000 in the program's first year to more than 2.8 million in year three.
Thomas Gais, director of the Rockefeller Institute, commented on the report and the forum: "What I find impressive about New York's implementation of the ACA is its integration of several different programs ---- including Medicaid, Child Health Plus, the Qualified Health Plans, and the Essential Plan ---- into a wide-ranging yet accessible whole for New York residents seeking health care. The federal government may operate these as separate 'silos.' But New York has connected them for the sake of its people. That's federalism at its best."
Specifics of the New York implementation were discussed in a public event held at the Rockefeller Institute on June 6th.
To read the report, go to www.rockinst.org/ACA/states/New_York/2016-06-New_York_Individual_Report.pdf.
To view the video of the event, go to www.youtube.com/watch?v=OPxbYpjb94Q.
Tuesday, May 31, 2016
Nancy Zimpher to end tenure as SUNY chancellor on June 30, 2017
Dear SUNY Family,
Serving as chancellor of The State University of New York during a time of such change and challenge, and of wonderful opportunities and possibilities, is a great honor. The strides we have made together to improve the delivery and quality of public higher education in New York State are the highlights of my career.
Today, I write to tell you that I will end my tenure as chancellor on June 30, 2017. My hope is that by sharing this news now, Chairman McCall and the SUNY Board of Trustees will have ample time to find my successor, someone who will continue to carry out our collective vision for SUNY.
When I came to SUNY seven years ago, New York was in a period of major transition. You know better than anyone the serious toll the Great Recession took on our state’s finances, creating challenges for our campuses and SUNY System Administration alike. As this university has done throughout its 60-plus year history, we rose to the challenge and met our responsibility to students, faculty, staff, and taxpayers. SUNY came together and worked in a more unified way than ever before. In realizing our full potential for systemness, we brought together SUNY’s 64 campuses to serve as an engine of economic revitalization and life-enhancing opportunity throughout our state.
Serving as chancellor of The State University of New York during a time of such change and challenge, and of wonderful opportunities and possibilities, is a great honor. The strides we have made together to improve the delivery and quality of public higher education in New York State are the highlights of my career.
Today, I write to tell you that I will end my tenure as chancellor on June 30, 2017. My hope is that by sharing this news now, Chairman McCall and the SUNY Board of Trustees will have ample time to find my successor, someone who will continue to carry out our collective vision for SUNY.
When I came to SUNY seven years ago, New York was in a period of major transition. You know better than anyone the serious toll the Great Recession took on our state’s finances, creating challenges for our campuses and SUNY System Administration alike. As this university has done throughout its 60-plus year history, we rose to the challenge and met our responsibility to students, faculty, staff, and taxpayers. SUNY came together and worked in a more unified way than ever before. In realizing our full potential for systemness, we brought together SUNY’s 64 campuses to serve as an engine of economic revitalization and life-enhancing opportunity throughout our state.
Thursday, May 19, 2016
|
Thursday, May 12, 2016
Scammers push people to pay with iTunes gift cards
By Amy Hebert, Consumer Education Specialist, FTC
One thing we know about scammers — they want money, and they want it fast. That’s why, whatever the con they’re running, they usually ask people to pay a certain way. They want to make it easy for themselves to get the money — and nearly impossible for you to get it back.
Their latest method? iTunes gift cards. To convince you to pay, they might pretend to be with the IRS and say you’ll be arrested if you don’t pay back taxes right now. Or pose as a family member or online love interest who needs your help fast. But as soon as you put money on a card and share the code with them, the money’s gone for good.
If you’re not shopping at the iTunes store, you shouldn’t be paying with an iTunes gift card. Other payment methods scammers might ask for include Amazon gift cards, PayPal, reloadable cards like MoneyPak, Reloadit, or Vanilla, or by wiring money through services like Western Union or MoneyGram. Government offices won’t require you to use these payment methods.
If you get targeted by a scam like this, report it to the FTC at ftc.gov/complaint.
Want to know more about avoiding scams? Read 10 Ways to Avoid Fraud.
Tuesday, May 10, 2016
Don't Pay to Self-Publish
From J A Konrath:
DON'T PAY ANYONE TO PUBLISH YOU.
Now you can certainly pay people to help you publish. Freelancers such as editors, cover artists, book formatters, proofreaders, and so on.
But when you hire a freelancer to assist you, you keep your rights.
That's very important.
When you write something, you own the copyright. That's automatic, even if you don't register with the copyright office.
Copyright means exactly that; you have the right to copy it, to distribute it, to give it away, to sell it. You own those rights.
But if you pay someone to publish you, you GIVE THEM YOUR RIGHTS.
NEVER GIVE ANYONE YOUR RIGHTS.
DON'T PAY ANYONE TO PUBLISH YOU.
Now you can certainly pay people to help you publish. Freelancers such as editors, cover artists, book formatters, proofreaders, and so on.
But when you hire a freelancer to assist you, you keep your rights.
That's very important.
When you write something, you own the copyright. That's automatic, even if you don't register with the copyright office.
Copyright means exactly that; you have the right to copy it, to distribute it, to give it away, to sell it. You own those rights.
But if you pay someone to publish you, you GIVE THEM YOUR RIGHTS.
NEVER GIVE ANYONE YOUR RIGHTS.
Monday, May 9, 2016
NYS Earned Income Tax Credit
NYS Tax Department Issues Earned Income Tax Credit (EITC): Summary of Credit Claims through Tax year 2014
Each type of EITC is explained, and the specifics provided. For information on claiming these credits, see the links.
Wednesday, May 4, 2016
Husband and wife employed in 48% of married-couple families in 2015
In 2015, the share of families with an employed member was 80.3 percent, up by 0.2 percentage point from 2014. Families maintained by women with no spouse present remained less likely to have an employed member (75.0 percent) than families maintained by men with no spouse present (82.9 percent) or married-couple families (81.4 percent).
Among married-couple families, both the husband and wife were employed in 48.0 percent of families; in 19.8 percent of married-couple families only the husband was employed, and in 7.1 percent only the wife was employed.
Tuesday, May 3, 2016
Time Spent with Facebook Still Growing, but Not by Much
From eMarketer
This year, Americans will spend more than half of their social networking time on Facebook, according to eMarketer’s latest forecast of time spent with media. Going forward, however, growing competition from other social networks will make it increasingly challenging for Facebook to significantly grow engagement time.
In 2016, US adults will spend an average of 22 minutes a day on Facebook. By comparison, they will spend an average of 43 minutes a day on social networks in general. By 2018, US adults will be spending three more minutes each day on social networks, but just one additional minute on Facebook.
This year, Americans will spend more than half of their social networking time on Facebook, according to eMarketer’s latest forecast of time spent with media. Going forward, however, growing competition from other social networks will make it increasingly challenging for Facebook to significantly grow engagement time.
In 2016, US adults will spend an average of 22 minutes a day on Facebook. By comparison, they will spend an average of 43 minutes a day on social networks in general. By 2018, US adults will be spending three more minutes each day on social networks, but just one additional minute on Facebook.
Friday, April 29, 2016
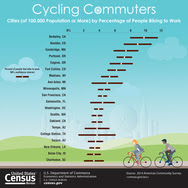
Bike to Work Week, May 16-20
|
Thursday, April 28, 2016
How the Other Fifth Lives
From the New York Times:
For years now, people have been talking about the insulated world of the top 1 percent of Americans, but the top 20 percent of the income distribution is also steadily separating itself — by geography and by education as well as by income.
This self-segregation of a privileged fifth of the population is changing the American social order and the American political system, creating a self-perpetuating class at the top, which is ever more difficult to break into.
In hard numbers, the percentage of families with children living in very affluent neighborhoods more than doubled between 1970 and 2012, from 6.6 percent to 15.7 percent.
At the same time, the percentage of families with children living in traditional middle class neighborhoods with median incomes between 80 and 125 percent of the surrounding metropolitan area fell from 64.7 percent in 1970 to 40.5 percent.
For years now, people have been talking about the insulated world of the top 1 percent of Americans, but the top 20 percent of the income distribution is also steadily separating itself — by geography and by education as well as by income.
This self-segregation of a privileged fifth of the population is changing the American social order and the American political system, creating a self-perpetuating class at the top, which is ever more difficult to break into.
In hard numbers, the percentage of families with children living in very affluent neighborhoods more than doubled between 1970 and 2012, from 6.6 percent to 15.7 percent.
At the same time, the percentage of families with children living in traditional middle class neighborhoods with median incomes between 80 and 125 percent of the surrounding metropolitan area fell from 64.7 percent in 1970 to 40.5 percent.
Wednesday, April 27, 2016
Federal Court Finds Amazon Liable for Billing Parents for Children’s Unauthorized In-App Charges
Court Will Decide Amount of Monetary Relief Amazon Owes in Coming Months
A federal judge has granted the Federal Trade Commission’s request for summary judgment in the agency’s lawsuit against Amazon, Inc., for billing consumers for unauthorized in-app charges incurred by children.
The judge’s order in the case finds that Amazon received many complaints from consumers about surprise in-app charges incurred by children, citing the fact that the company’s disclosures about the possibility of in-app charges within otherwise “free” apps were not sufficient to inform consumers about the charges.
“We are pleased the federal judge found Amazon liable for unfairly billing consumers for unauthorized in-app purchases by children,” said FTC Chairwoman Edith Ramirez. “We look forward to making a case for full refunds to consumers as a result of Amazon’s actions.”
The order calls for further representations from the FTC and Amazon regarding the precise amount of monetary relief Amazon owes consumers as a result of its unlawful practices. In addition, the order grants a partial summary judgment requested by Amazon regarding injunctive relief requested by the FTC in the case.
The FTC’s case against Amazon was first filed in July, 2014. The FTC reached settlements with Apple, Inc. and Google, Inc. related to unauthorized in-app charges incurred by children requiring the companies to fully refund consumers for such charges, resulting in refunds to consumers totaling over $50 million.
Tuesday, April 26, 2016
Characteristics of minimum wage workers, 2015
From the Bureau of Labor Statistics:
In 2015, 78.2 million workers age 16 and older in the United States were paid at hourly rates, representing 58.5 percent of all wage and salary workers. Among those paid by the hour, 870,000 workers earned exactly the prevailing federal minimum wage of $7.25 per hour. About 1.7 million had wages below the federal minimum. Together, these 2.6 million workers with wages at or below the federal minimum made up 3.3 percent of all hourly paid workers.
The percentage of hourly paid workers earning the prevailing federal minimum wage or less declined from 3.9 percent in 2014 to 3.3 percent in 2015. This remains well below the percentage of 13.4 recorded in 1979, when data for hourly-paid were first collected on a regular basis.
This report presents highlights and statistical tables describing workers who earned at or below the federal minimum wage in 2015. The data are obtained from the Current Population Survey (CPS), a national monthly survey of approximately 60,000 households conducted by the U.S. Census Bureau for the U.S. Bureau of Labor Statistics (BLS). Information on earnings is collected from one-fourth of the CPS sample each month.
The CPS does not include questions on whether workers are covered by the minimum wage provisions of the federal Fair Labor Standards Act (FLSA) or by individual state or local minimum wage laws. The estimates of workers paid at or below the federal minimum wage are based solely on the hourly wage they report, which does not include overtime pay, tips, or commissions.
In 2015, 78.2 million workers age 16 and older in the United States were paid at hourly rates, representing 58.5 percent of all wage and salary workers. Among those paid by the hour, 870,000 workers earned exactly the prevailing federal minimum wage of $7.25 per hour. About 1.7 million had wages below the federal minimum. Together, these 2.6 million workers with wages at or below the federal minimum made up 3.3 percent of all hourly paid workers.
The percentage of hourly paid workers earning the prevailing federal minimum wage or less declined from 3.9 percent in 2014 to 3.3 percent in 2015. This remains well below the percentage of 13.4 recorded in 1979, when data for hourly-paid were first collected on a regular basis.
This report presents highlights and statistical tables describing workers who earned at or below the federal minimum wage in 2015. The data are obtained from the Current Population Survey (CPS), a national monthly survey of approximately 60,000 households conducted by the U.S. Census Bureau for the U.S. Bureau of Labor Statistics (BLS). Information on earnings is collected from one-fourth of the CPS sample each month.
The CPS does not include questions on whether workers are covered by the minimum wage provisions of the federal Fair Labor Standards Act (FLSA) or by individual state or local minimum wage laws. The estimates of workers paid at or below the federal minimum wage are based solely on the hourly wage they report, which does not include overtime pay, tips, or commissions.
Labels:
BLS,
Labor Department,
minimum wage,
wages
Monday, April 25, 2016
Older Americans Month: May 2016
President Kennedy first celebrated older Americans by designating May 1963 as Senior Citizens Month. After a meeting with the National Council of Senior Citizens, Kennedy encouraged all Americans to pay tribute to older people across the country. Every President since has issued a formal proclamation during or before the month of May in support of older Americans. In 1980, President Jimmy Carter’s proclamation changed the name to Older Americans Month. This month continues to be a time to celebrate those 65 and older through ceremonies, events and public recognition.
46.2 million
The number of people who were 65 and older in the United States on July 1, 2014. This group accounted for 14.5 percent of the total population. The 65 and older population grew from 44.7 million in 2013. Source: 2014 Population Estimates <http://factfinder.census.gov/ bkmk/table/1.0/en/PEP/2014/ PEPAGESEX> <http://www.census.gov/ newsroom/press-releases/2015/ cb15-113.html>
98.2 million
Projected population of people 65 and older in 2060. People in this age group would comprise nearly one in four U.S. residents at that time. Of this number, 19.7 million would be 85 or older. Source: 2014 National Population Projections, Table 3 <http://www.census.gov/ population/projections/data/ national/2014/summarytables. html>
2.4 million
Projected number of baby boomers in 2060. At that time, the youngest baby boomers would be 96 years old. Source: Population Estimates and Projections <http://www.census.gov/prod/ 2014pubs/p25-1141.pdf>
2033
The year in which, for the first time, the population 65 and older would outnumber people younger than 18 in the U.S. Source: 2014 National Population Projections <http://www.census.gov/ population/projections/data/ national/2014.html>
Thursday, April 21, 2016
US ranks 41 out of 180 in global press freedom
From BoingBoing:
Uruguay, Namibia, Samoa, Ghana, and South Africa all offer a greater "level of freedom of information” than the United States, according to Reporters Without Borders' 2016 World Press Freedom Index. The U.S. is ranked at 41 out of 180 countries in the survey.
RSF says the U.S. moved from 49th place in 2015 up to 41 this year, but "relative improvement by comparison hides overall negative trends." In other words, we're still screwed on press freedom, and the future doesn't look great.
From NPR's Laura Wagner, on The Two-Way:
Uruguay, Namibia, Samoa, Ghana, and South Africa all offer a greater "level of freedom of information” than the United States, according to Reporters Without Borders' 2016 World Press Freedom Index. The U.S. is ranked at 41 out of 180 countries in the survey.
RSF says the U.S. moved from 49th place in 2015 up to 41 this year, but "relative improvement by comparison hides overall negative trends." In other words, we're still screwed on press freedom, and the future doesn't look great.
From NPR's Laura Wagner, on The Two-Way:
Citing the U.S. government's "war on whistleblowers who leak information about its surveillance activities, spying and foreign operations, especially those linked to counter-terrorism," and the country's lack of a "shield law" that would allow journalists to protect confidential sources, the report takes a decidedly negative view of U.S. press freedom.
Monday, April 18, 2016
How is New York City growing if it’s constantly losing people?
From Stat Chat @the University of Virginia
Year after year, some of the nation’s most dynamic cities are also the nation’s biggest losers when it comes to migrants. Yet rather than waste away, they continue to boom. This widely misunderstood paradox leads to some interesting articles every time the Census Bureau releases a new round of county population and migration estimates, as it did several weeks ago.
New York City is the prime example, as it is for most urban phenomena in the U.S. Four of New York’s five boroughs – all but Staten Island – were among the eight counties with the biggest losses in net domestic migration last year...
The conclusion suggested by domestic migration numbers is that New York is dying as its residents abandon ship, dragging down statewide migration numbers with it. New Yorkers would be right to question such pronouncements in the face of their skyrocketing rents, though. The city is as crowded and economically powerful as ever. Its population continues to climb despite an astronomical cost of living that suggests even more people would live there if they could. From 2010 to 2015, the Census Bureau estimates that New York City’s population increased by over 375,000. This is despite the fact that it had a net loss of over 400,000 migrants to other parts of the country.
Year after year, some of the nation’s most dynamic cities are also the nation’s biggest losers when it comes to migrants. Yet rather than waste away, they continue to boom. This widely misunderstood paradox leads to some interesting articles every time the Census Bureau releases a new round of county population and migration estimates, as it did several weeks ago.
New York City is the prime example, as it is for most urban phenomena in the U.S. Four of New York’s five boroughs – all but Staten Island – were among the eight counties with the biggest losses in net domestic migration last year...
The conclusion suggested by domestic migration numbers is that New York is dying as its residents abandon ship, dragging down statewide migration numbers with it. New Yorkers would be right to question such pronouncements in the face of their skyrocketing rents, though. The city is as crowded and economically powerful as ever. Its population continues to climb despite an astronomical cost of living that suggests even more people would live there if they could. From 2010 to 2015, the Census Bureau estimates that New York City’s population increased by over 375,000. This is despite the fact that it had a net loss of over 400,000 migrants to other parts of the country.
Friday, April 15, 2016
Gambling Not a Solution to State Revenue Woes
From the Rockefeller Institute:
States turning to gambling as a possible quick fix for revenue woes have often been disappointed with the results, according to a just released study from the Nelson A. Rockefeller Institute of Government, entitled State Revenues From Gambling: Short-Term Relief, Long-Term Disappointment [PDF link].
According to Lucy Dadayan, senior policy analyst at the Institute and principal author of the report, despite the steep declines in tax revenues during the "Great Recession" most states were reluctant to raise taxes on income or sales. As an alternative, she reports, officials in many states turned to taxes on gambling, part of what are often called "sin taxes." In the recession's wake, over a dozen of states have legalized and expanded different forms of gambling activities in the hopes of raising more revenues, despite the fact gambling revenue plays a small role in state budgets, ranging between 2.0 and 2.5 percent of state own-source general revenues in the typical state.
The report demonstrates that tax and fee revenues from gambling activities have softened considerably in recent years, due, in part, to market saturation and industry cannibalization.
States turning to gambling as a possible quick fix for revenue woes have often been disappointed with the results, according to a just released study from the Nelson A. Rockefeller Institute of Government, entitled State Revenues From Gambling: Short-Term Relief, Long-Term Disappointment [PDF link].
According to Lucy Dadayan, senior policy analyst at the Institute and principal author of the report, despite the steep declines in tax revenues during the "Great Recession" most states were reluctant to raise taxes on income or sales. As an alternative, she reports, officials in many states turned to taxes on gambling, part of what are often called "sin taxes." In the recession's wake, over a dozen of states have legalized and expanded different forms of gambling activities in the hopes of raising more revenues, despite the fact gambling revenue plays a small role in state budgets, ranging between 2.0 and 2.5 percent of state own-source general revenues in the typical state.
The report demonstrates that tax and fee revenues from gambling activities have softened considerably in recent years, due, in part, to market saturation and industry cannibalization.
Labels:
gambling,
revenues,
Rockefeller Institute,
states
Thursday, April 14, 2016
Most Large Profitable U.S. Corporations Paid Tax but Effective Tax Rates Differed Significantly from the Statutory Rate
What GAO Found
In each year from 2006 to 2012, at least two-thirds of all active corporations had no federal income tax liability. Larger corporations were more likely to owe tax. Among large corporations (generally those with at least $10 million in assets) less than half—42.3 percent—paid no federal income tax in 2012. Of those large corporations whose financial statements reported a profit, 19.5 percent paid no federal income tax that year. Reasons why even profitable corporations may have paid no federal tax in a given year include the use of tax deductions for losses carried forward from prior years and tax incentives, such as depreciation allowances that are more generous in the federal tax code than those allowed for financial accounting purposes. Corporations that did have a federal corporate income tax liability for tax year 2012 owed $267.5 billion.
Percentage of Corporations That Reported No Tax Liability after Tax Credits, Tax Years 2006 to 2012
These reasons also explain why corporate effective tax rates (ETR) can differ substantially from statutory tax rates. ETRs attempt to measure taxes paid as a proportion of economic income, while statutory rates indicate the amount of tax liability (before any credits) relative to taxable income, which is defined by tax law and reflects tax benefits built into the law. The statutory tax rate on net corporate income ranges from 15 to 35 percent, depending on the amount of income earned. For tax years 2008 to 2012, profitable large U.S. corporations paid, on average, U.S. federal income taxes amounting to about 14 percent of the pretax net income that they reported in their financial statements (for those entities included in their tax returns).
Tuesday, April 12, 2016
Demographic and Economic Profiles of New York’s Electorate
In advance of the New York primary on April 19, the U.S. Census Bureau presents a variety of statistics that give an overall profile of the state’s voting-age population and industries. Statistics include:
· Breakdown of voting-age population by race and Hispanic origin (Hispanic origin and race alone) (race alone or in combination).
· Selected economic characteristics, including median household income and poverty.
· Selected social characteristics, including educational attainment.
· County Business Patterns (providing information on employment by specific industries).
· Statistics on voting and registration.
Friday, April 8, 2016
UN Data -recent updates
Visit UN Data metadata
The Human Development Report is a reliable source and an alternative perspective on critical issues for human development worldwide. Featuring the Human Development Index, every report presents agenda-setting data and analysis and calls international attention to issues and policy options that put people at the center of strategies to meet the challenges of development today - economic, social, political, and cultural.
Last update in UNdata: 22 Mar 2016
The Economic Statistics Branch of the United Nations Statistics Division (UNSD) maintains and annually updates the National Accounts Main Aggregates database. It consists of a complete and consistent set of time series, from 1970 onwards, of the main National Accounts aggregates of all UN Members States and other territories in the world for which National Accounts information is available. Its contents are based on the official data reported to UNSD through the annual National Accounts Questionnaire, supplemented with data estimates for any years and countries with incomplete or inconsistent information.
Last update in UNdata: 16 Mar 2016
The UNESCO Institute for Statistics (UIS) provides UNdata with a subset of the more than 1,000 indicators which may be found in the UIS Data Centre.
The UIS Data Centre contains indicators and raw data on education, literacy, science, culture and communication. The UIS collects these data from more than 200 countries and international organizations.
Last update in UNdata: 24 Feb 2016
The Millennium Development Goals Database presents official data for more than 60 indicators to measure progress towards the Millennium Development Goals. The data and analyses are the product of the work of the Inter-agency and Expert Group (IAEG), coordinated by the United Nations Statistics Division.
Last update in UNdata: 24 Feb 2016
The Greenhouse Gas (GHG) Inventory Data
The Human Development Report is a reliable source and an alternative perspective on critical issues for human development worldwide. Featuring the Human Development Index, every report presents agenda-setting data and analysis and calls international attention to issues and policy options that put people at the center of strategies to meet the challenges of development today - economic, social, political, and cultural.
Last update in UNdata: 22 Mar 2016
The Economic Statistics Branch of the United Nations Statistics Division (UNSD) maintains and annually updates the National Accounts Main Aggregates database. It consists of a complete and consistent set of time series, from 1970 onwards, of the main National Accounts aggregates of all UN Members States and other territories in the world for which National Accounts information is available. Its contents are based on the official data reported to UNSD through the annual National Accounts Questionnaire, supplemented with data estimates for any years and countries with incomplete or inconsistent information.
Last update in UNdata: 16 Mar 2016
The UNESCO Institute for Statistics (UIS) provides UNdata with a subset of the more than 1,000 indicators which may be found in the UIS Data Centre.
The UIS Data Centre contains indicators and raw data on education, literacy, science, culture and communication. The UIS collects these data from more than 200 countries and international organizations.
Last update in UNdata: 24 Feb 2016
The Millennium Development Goals Database presents official data for more than 60 indicators to measure progress towards the Millennium Development Goals. The data and analyses are the product of the work of the Inter-agency and Expert Group (IAEG), coordinated by the United Nations Statistics Division.
Last update in UNdata: 24 Feb 2016
The Greenhouse Gas (GHG) Inventory Data
Thursday, April 7, 2016
Data USA
From Data USA, re its origins in 2014:
The site was referenced in the New York Times in April 2016.
A team comprised of economists, data scientists, designers, researchers and business executives, worked for over a year with input from policymakers, government officials and everyday citizens to develop Data USA, the most comprehensive website and visualization engine of public US Government data. Data USA tells millions of stories about America. Through advanced data analytics and visualization, it tells stories about: places in America—towns, cities and states; occupations, from teachers to welders to web developers; industries--where they are thriving, where they are declining and their interconnectedness to each other; and education and skills, from where is the best place to live if you’re a computer science major to the key skills needed to be an accountant.
Data USA puts public US Government data in your hands. Instead of searching through multiple data sources that are often incomplete and difficult to access, you can simply point to Data USA to answer your questions. Data USA provides an open, easy-to-use platform that turns data into knowledge. It allows millions of people to conduct their own analyses and create their own stories about America – its people, places, industries, skill sets and educational institutions. Ultimately, accelerating society’s ability to learn and better understand itself.
The site was referenced in the New York Times in April 2016.
Monday, April 4, 2016
Thursday, March 31, 2016
Population is dropping faster in upstate New York counties
From Empire Center:
Upstate New York’s population began to decline at a faster rate between mid-2014 and 2015, according to updated Census Bureau estimates.
As of last July 1, the 50 counties north of the mid-Hudson Valley had a combined population of 6,307,573—down 17,623 from the Census Bureau estimate of a year earlier. The drop in 2014-15 alone exceeded the population decrease in the previous four years, bringing the total population decline since the 2010 census to 31,740 people, or 0.5 percent. By contrast, upstate New York’s population increased by 52,074, or 0.8 percent, between 2000 and 2010.
Upstate New York’s population began to decline at a faster rate between mid-2014 and 2015, according to updated Census Bureau estimates.
As of last July 1, the 50 counties north of the mid-Hudson Valley had a combined population of 6,307,573—down 17,623 from the Census Bureau estimate of a year earlier. The drop in 2014-15 alone exceeded the population decrease in the previous four years, bringing the total population decline since the 2010 census to 31,740 people, or 0.5 percent. By contrast, upstate New York’s population increased by 52,074, or 0.8 percent, between 2000 and 2010.
Labels:
New York State,
population,
upstate New York
Tuesday, March 29, 2016
Alternative Internet archive sites to the Wayback Machine
Stolen from a librarian, naturally:
A list of 50 sites similar to waybackmachine.org - http://www.similarsitesearch. com/alternatives-to/ waybackmachine.org
Top 5 Best Internet Archive Wayback Machine Alternative Sites http://technofizi.com/best- internet-archive-wayback- machine-alternative-sites/
Alternatives to Wayback Machine for all platforms http://alternativeto.net/ software/wayback-machine/
Best Wayback Machine Alternative Sites
http://beebom.com/2015/09/ wayback-machine-alternative
The Best WayBack Machine Alternative
http://authoritywebsiteincome. com/wayback-machine- alternative/
List of Web archiving initiatives
https://en.wikipedia.org/wiki/ List_of_Web_archiving_ initiatives
11 Best Wayback Machine Alternatives in 2016 to Check History of Websites http://www.pingzic.com/best- wayback-machine-alternatives- in-2016-to-check-history-of- websites/
A list of 50 sites similar to waybackmachine.org - http://www.similarsitesearch.
Top 5 Best Internet Archive Wayback Machine Alternative Sites http://technofizi.com/best-
Alternatives to Wayback Machine for all platforms http://alternativeto.net/
Best Wayback Machine Alternative Sites
http://beebom.com/2015/09/
The Best WayBack Machine Alternative
http://authoritywebsiteincome.
List of Web archiving initiatives
https://en.wikipedia.org/wiki/
11 Best Wayback Machine Alternatives in 2016 to Check History of Websites http://www.pingzic.com/best-
Monday, March 28, 2016
U.S. Population Aging Slower than Other Countries
America’s 65-and-over population is projected to nearly double over the next three decades, ballooning from 48 million to 88 million by 2050. However, the U.S. Census Bureau projects the U.S. population will age at a slower rate compared with other countries.
Worldwide, the 65-and-over population will more than double to 1.6 billion by 2050, according to An Aging World: 2015. This new report from the Census Bureau examines the continuing global aging trend and projected growth of the population age 65 and over, with an emphasis on the differences among world regions.
In 2015, 14.9 percent of the U.S. population was 65 or over.
“The United States was the 48th oldest country out of 228 countries and areas in the world in 2015,” said Wan He, a demographer on population aging research at the Census Bureau. “Baby boomers began reaching age 65 in 2011 and by 2050 the older share of the U.S. population will increase to 22.1 percent. However, the U.S. will fall to 85th because of the more rapid pace of aging in many Asian and Latin American countries.”
Japan is the current oldest country in the world and will retain that position in 2050.
“However, South Korea, Hong Kong and Taiwan are projected to overtake Germany, Italy and Greece for second, third and fourth place by 2050,” He said.
Some countries, including China, India, Indonesia, Brazil, Colombia and Cuba, will experience a quadrupling of their oldest-old population, those 80 and over, from 2015 to 2050.
While Europe is still the oldest region today and is projected to remain so by 2050, aging in Asia and Latin America has accelerated in recent decades. Asia is also notable for leading the world in the size of the older population with 341 million people 65 and older. On the other hand, Africa remained young in 2015, where only 3.5 percent of the total population was 65 and over.
Other highlights:
Employment
· Labor force participation among the older population continues to rise in many developed countries, yet remains highest in low-income countries.
Saturday, March 26, 2016
Infographic: A Digital Nation
The latest Census Bureau statistics shows more American households owncomputers and use high-speed Internet than ever before. A collection of visualizations presents data from the Current Population Survey and American Community Survey.
The infographic illustrates high- speed Internet use by age, race, income and educational attainment by household. In addition, maps are provided for household high-speed Internet use by state and metro area. Internet address: <http://www.census.gov/ library/visualizations/2016/ comm/digital_nation.html>.
Thursday, March 24, 2016
2015 County and Economic Development Regions Population Estimates for New York State
On March 24th, 2016 the U.S. Census Bureau released the County total population estimates for July 1, 2015. The change in population is split in change due to natural increase and due to net-migration. Natural increase is the difference between the number of births and the number of deaths, net-migration the result of people moving in and out of a region.
Six economic regions gained population since April 1, 2010, New York City the most in number (375,443) and in percentage (4.6%). Four economic regions lost population since the latest Decennial Census; the Southern Tier lost the most in number (-9,228) and the Mohawk Valley most in percentage (-1.8%).
More from the Program on Applied Demographics
Six economic regions gained population since April 1, 2010, New York City the most in number (375,443) and in percentage (4.6%). Four economic regions lost population since the latest Decennial Census; the Southern Tier lost the most in number (-9,228) and the Mohawk Valley most in percentage (-1.8%).
More from the Program on Applied Demographics
Wednesday, March 23, 2016
Finding an organization’s Form 990 or 990-PF
According to IRS disclosure regulations, exempt organizations must make its three most recently filed annual 990 or 990-PF returns and all related supporting documents available for public inspection. This public disclosure rule also applies to Form 1023, which is filed to obtain exempt status.
Please note that there can be a 12-18 month lag period between the end of an organization's fiscal year and the point when its IRS return is available to the public.
See more from Grantspace
Please note that there can be a 12-18 month lag period between the end of an organization's fiscal year and the point when its IRS return is available to the public.
See more from Grantspace
Monday, March 21, 2016
Homeowners and Renters Insurance stats
In 2014, 5.3 percent of insured homes had a claim, according to ISO. Property damage, including theft, accounted for 97.3 percent of those claims. Changes in the percentage of each type of homeowners loss from one year to another are partially influenced by large fluctuations in the number and severity of weather-related events such as hurricanes and winter storms. There are two ways of looking at losses: by the average number of claims filed per 100 policies (frequency) and by the average amount paid for each claim (severity).
On average, over the past nine years about half of homeowners said they prepared an inventory of their possessions to help document losses for their insurers, according to polls conducted for the Insurance Information Institute (I.I.I.). Fifty-two percent of homeowners said they had an inventory in a June 2015 I.I.I. survey.
More from the Insurance Information Institute
On average, over the past nine years about half of homeowners said they prepared an inventory of their possessions to help document losses for their insurers, according to polls conducted for the Insurance Information Institute (I.I.I.). Fifty-two percent of homeowners said they had an inventory in a June 2015 I.I.I. survey.
More from the Insurance Information Institute
Friday, March 18, 2016
Monday, March 14, 2016
March is Irish-American Heritage Month
Congress proclaimed March as Irish-American Heritage Month in 1991, and the President issues a proclamation commemorating the occasion each year.
Originally a religious holiday to honor St. Patrick, who introduced Christianity to Ireland in the fifth century, St. Patrick’s Day has evolved into a celebration of all things Irish. The world’s first St. Patrick’s Day parade occurred on March 17, 1762, in New York City, featuring Irish soldiers serving in the English military. This parade became an annual event, with President Truman attending in 1948.
Where They Live
33.1 million, or 10.4%
Number and percentage of U.S. residents who claimed Irish ancestry in 2014. This number was more than seven times the population of Ireland itself (4.6 million). Irish was the nation’s second-most frequently reported European ancestry, trailing German. Sources: 2014 American Community Survey, Table B04006 http://factfinder.census.gov/
21.5%
Percentage of Massachusetts residents who claimed Irish ancestry in 2014. New Hampshire, at 20.9 percent, is the only other state in which more than 20 percent claimed Irish ancestry.
|
Tuesday, March 8, 2016
Buffalo ranks No. 1 for anti-gay slurs used in tweets
People in Buffalo use words considered offensive and derogatory to gays in their tweets more often than people in any other city in the United States, according to a recent study.
Such terms showed up in Buffalonians’ tweets more than among tweets from any other city, the study found. Arlington, Texas, and Riverside, Calif., came in a relatively close second and third.
The study has been stirring conversation locally about the factors that might have pushed Buffalo to the top of the list – and what its dubious distinction as No. 1 on that list actually means, in a city that flies rainbow flags along Elmwood Avenue every June, marking a pride celebration that seems to grow bigger each year.
More from the Buffalo News.
Such terms showed up in Buffalonians’ tweets more than among tweets from any other city, the study found. Arlington, Texas, and Riverside, Calif., came in a relatively close second and third.
The study has been stirring conversation locally about the factors that might have pushed Buffalo to the top of the list – and what its dubious distinction as No. 1 on that list actually means, in a city that flies rainbow flags along Elmwood Avenue every June, marking a pride celebration that seems to grow bigger each year.
More from the Buffalo News.
Friday, March 4, 2016
The Measles Mystery
In the 1960s, children throughout the America began receiving a vaccination for measles. And the vaccine, by and large, made the disease history. But that's not all that happened. As NPR reported, after widespread use of the vaccine began, "childhood deaths from all infectious diseases plummeted. Even deaths from diseases like pneumonia and diarrhea were cut by half." Somehow, the measles vaccine was keeping other diseases at bay, too.
And until recently, no one knew why.
More from Now I Know.
And until recently, no one knew why.
More from Now I Know.
Tuesday, March 1, 2016
Women’s Earnings by Occupation from the 2014 American Community Survey
The U.S. Census Bureau released today a new table showing median earnings by detailed occupation from the 2014 American Community Survey. The table shows ratios indicating the percentage of women in an occupation, as well as the male-to-female earnings ratio in the occupation for full-time, year-round workers in the past 12 months. Internet address: http://www.census.gov/people/ io/publications/table_ packages.html.
Labels:
American Community Survey,
Census Bureau,
earnings,
occupations,
women
Subscribe to:
Posts (Atom)