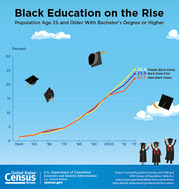
To commemorate and celebrate the contributions to our nation made by people of African descent, American historian Carter G. Woodson established Black History Week. The first celebration occurred on Feb. 12, 1926. For many years, the second week of February was set aside for this celebration to coincide with the birthdays of abolitionist/editor Frederick Douglass and Abraham Lincoln. In 1976, as part of the nation’s bicentennial, the week was expanded to a month. Since then, U.S. presidents have proclaimed February as National African-American History Month.
The following facts are made possible by the invaluable responses to the U.S. Census Bureau’s surveys. We appreciate the public’s cooperation as we continuously measure America’s people, places, and economy.
Note: The reference to the black population in this publication is to single-race black people (“black alone”) unless otherwise noted.
Did You Know?
The black population, either alone or in combination with one or more races, in the United States. Source: 2016 Population Estimates
The number of black military veterans in the United States nationwide. Source: 2016 American Community Survey
The percentage of the black population 16 and older working in management, business, science and arts occupations in 2016. Source: 2016 American Community Survey(Source includes more on occupations, commuting, and industries.)
Percentage of African-Americans completing high school. Source: 2016 Current Population Survey (Source includes more on education, including advanced degrees and school enrollment.)
The number of black-owned employer firm businesses in the United States in 2015. Source: 2015 Annual Survey of Entrepreneurs
More on Population Size
Voting Rates
Income, Poverty and Health Insurance
· Income
More Stats
See a detailed profile of the black population from the 2016 American Community Survey. Statistics include:
· Families and children
· Marital status
· Grandparents living with grandchildren
· Jobs
· Labor force participation
· Occupation
· Commuting
· Housing
Related News Products
Past Facts for Features
Stats for Stories
Releases
Graphics
|
Friday, February 2, 2018
Black) History Month: February 2018

Thursday, February 1, 2018
Disaster Prep on a Budget

It’s no secret the world is a dangerous place. Every day, we hear about something – whether caused by humans or nature – that’s turned lives upside down. Bad news greets us in the morning and follows us to bed at night.
What are we to do?
Fear and stress are killers. They kill us from the inside out. We must find constructive ways to defuse the situation. Faith practices, physical exercise, counseling and peer groups… all can help, but there’s one thing everyone should consider: Get prepared.
When you take the initiative to recognize potential problems and prepare to deal with them when and if they come, you not only position yourself to face those difficulties, but knowing you’re ready helps lower stress.
In this guide, we’ll talk about disaster preparedness. We’ll talk about the supplies and equipment you and your family need to weather out the storm or make it through the crisis. And we’ll suggest ways you can save money and still get high-quality goods.
By getting ready now, you won’t have to worry so much about what might happen. If a news alert says severe weather is headed your way, you’ll be ready for it.
You’ll know that whatever comes down the pike, you’re not going to be joining the crowd desperately trying to find a store with something left on the shelves or wondering how in the world to live without water and electricity.
We’ve tried to keep the recommendations here in line with those suggested by the American Red Cross. Responding to disasters is a big part of what they do every day.
Monday, January 29, 2018
Which Congressional district is the most German? Wisconsin's 6th

You might be surprised to find out that German-American is the most common ancestry in the United States, at least according to the Census Bureau; 13.9 percent of Americans claim German ancestry, compared with 10.0 for Irish ancestry and 7.4 percent for English ancestry.
(One theory is that many people who do have primarily English ancestry are from families that have been in the U.S. for so long that there’s no remaining sense of distinct roots, and some of them may end up claiming "American" ancestry instead.)
But German ancestry is, despite how common it is, a fairly regionally-specific ancestry; there’s very little of it in the South, and while it’s more common in the Northeast, it’s by far most heavily concentrated in the Midwest, especially the Upper Midwest: Wisconsin, Minnesota, Iowa, and the Dakotas.
The largest flow of German immigrants in the 19th century was to the rapidly-growing cities of the Midwest like Milwaukee, Cincinnati, Omaha, and St. Louis. While these cities have lost much of their initial German identity thanks to subsequent waves of immigration and mostly ordinary domestic migration, German ancestry is still predominant in the rural areas of the Midwest where there hasn’t been much subsequent population growth.
See more in the TheMostDistrict series
Friday, January 26, 2018
Reward Work, Not Wealth
From Oxfam America:
 Last year saw the biggest increase in billionaires in history, one more every two days. Billionaires saw their wealth increase by $762bn in 12 months. This huge increase could have ended global extreme poverty seven times over.
82% of all wealth created in the last year went to the top 1%, while the bottom 50% saw no increase at all. Dangerous, poorly paid work for the many is supporting extreme wealth for the few. Women are in the worst work, and almost all the super-rich are men.
Governments must create a more equal society by prioritizing ordinary workers and small-scale food producers instead of the rich and powerful.
DOWNLOAD the report (76 pp., PDF)

82% of all wealth created in the last year went to the top 1%, while the bottom 50% saw no increase at all. Dangerous, poorly paid work for the many is supporting extreme wealth for the few. Women are in the worst work, and almost all the super-rich are men.
Governments must create a more equal society by prioritizing ordinary workers and small-scale food producers instead of the rich and powerful.
DOWNLOAD the report (76 pp., PDF)
Thursday, January 25, 2018
FTC Hosts Tax Identity Theft Awareness Week January 29-February 2
The Federal Trade Commission will mark Tax Identity Theft Awareness Week, January 29-February 2, with a series of free events to help consumers and businesses reduce their chances of becoming victims.
Tax identity theft occurs when a person uses someone else’s Social Security number to either file a tax return and claim the victim’s refund, or to earn wages that are reported as the victim’s income, leaving the victim with the tax bill.
The FTC will partner with the Internal Revenue Service, the Department of Veterans Affairs, the Treasury Inspector General for Tax Administration, and others throughout the week to co-host free webinars and Twitter chats focused on steps consumers and businesses can take to help avoid tax identity theft and recover if it occurs. There will also be discussions about ways to identify and avoid IRS imposter scams that target consumers and businesses.
The events on tap include:
Tax identity theft occurs when a person uses someone else’s Social Security number to either file a tax return and claim the victim’s refund, or to earn wages that are reported as the victim’s income, leaving the victim with the tax bill.
The FTC will partner with the Internal Revenue Service, the Department of Veterans Affairs, the Treasury Inspector General for Tax Administration, and others throughout the week to co-host free webinars and Twitter chats focused on steps consumers and businesses can take to help avoid tax identity theft and recover if it occurs. There will also be discussions about ways to identify and avoid IRS imposter scams that target consumers and businesses.
The events on tap include:
- January 29 at 2 p.m. ET: A webinar for consumers on tax identity theft and IRS imposter scams, how to protect yourself, and how to recover, co-hosted by the FTC and the Identity Theft Resource Center.
- January 30 at 2:30 p.m. ET: A webinar for older adults and other consumers on tax identity theft and IRS imposter scams, co-hosted by the FTC, AARP Fraud Watch Network, the AARP Foundation Tax-Aide program, and the Treasury Inspector General for Tax Administration.
- January 31 at 11 a.m. ET: A Twitter chat for service members, veterans, and their families, co-hosted by the FTC and the Department of Veterans Affairs. Join the conversation at #VeteranIDTheft.
- January 31 at 1 p.m. ET: A closed webinar co-hosted by the FTC, the Department of Veterans Affairs, and the Treasury Inspector General for Tax Administration, focused on tax identity theft and IRS imposter scams. This webinar is only available to Veterans Administration employees and patients.
- February 1 at 1 p.m. ET: A webinar for small businesses, Protecting Sensitive Business and Customer Data: Practical Identity Safety Practices for Your Business, co-hosted by the FTC and IRS focused on tax identity theft, imposter scams targeting businesses, cybersecurity practices to reduce your risk, and data breach response.
- February 1 at 3 p.m. ET: A Twitter chat for consumers on protecting yourself from tax identity theft, co-hosted by the FTC and the Identity Theft Resource Center. Join the conversation at #IDTheftChat.
Contact Information
MEDIA CONTACT:
Juliana Gruenwald Henderson
Office of Public Affairs
202-326-2924
STAFF CONTACT:
Seena Gressin
Bureau of Consumer Protection
202-326-2717
Juliana Gruenwald Henderson
Office of Public Affairs
202-326-2924
STAFF CONTACT:
Seena Gressin
Bureau of Consumer Protection
202-326-2717
Wednesday, December 20, 2017
Building the Case for Public Statistics, March 8 in DC
| ||||||||||||
| ||||||||||||
|


Tuesday, December 19, 2017
2017’s Most Charitable States

Tis the season for giving. And the latest World Giving Index shows that Americans are among the world’s most generous people, ranking No. 5 out of 140 countries. U.S. donors in 2016 gave more than $389 billion to charity, with 72 percent of the funds coming directly from individuals, according to the National Philanthropic Trust.
But Americans do more than reach in their pockets to help others. They also contribute their time — and plenty of it. Nearly 63 million people volunteer in the U.S., serving a combined total of 7.9 billion hours per year, the equivalent of $184 billion of service.
Not everyone is equally selfless, however. In the spirit of inspiring altruism, WalletHub determined the most charitable of the 50 states by comparing them across 14 key indicators of charitable behavior. Our dataset ranges from volunteer rate to share of income donated to share of sheltered homeless.
Monday, December 18, 2017
2016 Annual Survey of Manufactures and other reports
The 2016 Annual Survey of Manufactures (ASM) release includes general statistics, value of products shipments, industry-product analysis and geographic area statistics for 2015 and 2016. The ASM provides data about manufacturing that are crucial to accurate estimates of domestic production and productivity and to making sound decisions on economic trade policies. Companies, business analysts and trade associations use this data in planning investments, production and marketing.
This report presents data at the two- through six-digit North American Industry Classification System (NAICS) levels on employment, payroll, cost of materials, operating expenses, shipments and receipts for services, value added, and inventories.
This report presents product shipment statistics at the six-digit NAICS level and seven-digit NAICS product class level.

Presents value of shipments, including miscellaneous receipts, at the six-digit NAICS level by three-digit product code levels.
These reports present manufacturing statistics by state at the two- through four-digit NAICS levels and supplemental statistics for the United States and states at the two-digit NAICS level.
Saturday, December 16, 2017
High School Completion Rate Is Highest in U.S. History

For the first time in U.S. history, 90 percent of the population age 25 and older have completed high school. This is according to new Educational Attainment data released by the U.S. Census Bureau.
“In 1940, less than half of the population age 25 and older had a high school diploma. Over the years this has increased to the point where we now have 90 percent who have completed high school,” said Kurt Bauman, a demographer in the Social, Economic and Housing Statistics Division. “That means out of the 217 million people age 25 and older, 194 million have a high school diploma or higher.”
Between 2000 and 2017, the percentage of all people age 25 and older who had not completed high school decreased by more than one-third, dropping from 16 percent to 10 percent.
As high school educational attainment increased for the nation as a whole, attainment for minority populations also increased. Over the same time period, the percentage of blacks age 25 and older who had completed high school increased by 9 percentage points from 78 percent to 87 percent. The percentage of Hispanics age 25 and older who had completed high school increased by approximately 13 percentage points from 57 percent to 71 percent in the same time period. Non-Hispanic whites increased their high school completion 6 percentage points, from 88 percent to 94 percent.
Additionally, the increase in educational attainment goes beyond high school. The rate of attainment for a bachelor’s degree or higher increased from about 26 percent in 2000 to approximately 34 percent in 2017, an increase of 9 percentage points. Attainment of a bachelor’s degree or higher was greater for females age 25 and older (35 percent) than it was for males (34 percent). Of females between the ages of 25 and 34, 41 percent had attained a bachelor’s degree or higher.
More highlights:
· Asians were most likely to have at least a bachelor’s degree, with a rate of 55 percent for those age 25 and older. Among non-Hispanic whites, the rate was 38 percent. Among blacks, the rate was 24 percent. Among Hispanics of any race group age 25 and older, 17 percent had a bachelor’s degree or higher.
· Since 2000, the number of master’s degree holders has doubled to 21 million and the number of doctoral degree holders has doubled to 4 million.
· People with advanced degrees make up 13 percent of all U.S. adults, the percentage of the population that had a bachelor’s degree or higher in 1973.
· In 2017, 14 percent of immigrants to the United States held master’s, professional and doctoral degrees as compared to 13 percent of U.S. natives. To learn more about immigrant educational attainment, check out the Immigrant Families and Educational Attainment blog.
· College attainment of the population age 55 and older grew from 19 percent in 2000 to 30 percent in 2017. Part of this is accounted for by the aging of the baby-boom generation, which now makes up 70 percent of the population age 55 and older.
· From 2010 to 2016, mean earnings for workers with less than a high school education grew by 21 percent to $27,800. Other levels of education also saw increases in their earnings between 2010 and 2016. Earnings in 2016 for workers with a high school diploma or equivalent was $36,700, workers with a bachelor’s degree earned $67,300, and advanced degree holders earned $95,200.
The Current Population Survey, sponsored jointly by the Census Bureau and the U.S. Bureau of Labor Statistics, is the primary source of labor force statistics for the population of the United States.
###
|
Friday, December 15, 2017
The Unstoppable Growth of Fantasy Sports [Infographic]

Fantasy sports is a phenomenal business that has grown into a billion-dollar industry. One of the reasons behind the popularity of fantasy sports is the fact that fans feel like they have a real stake in the performance of their players and teams.
Sports lovers like to see themselves as strategists, as they create a fantasy football, basketball, baseball, or hockey team. They can trade players, adjust their team, and execute their best course of action. Fantasy players pay an entry fee ranging from $50-$100, leading to an average of $465 per player, annually. With their money on the line, players have an even bigger desire to win, which extends beyond watching an actual gameplay. This also adds to the huge money prizes that reach up to $2 billion.
Fantasy sports have changed the sports experience. Leagues and networks note increased viewership and fans are given the opportunity to get more involved in their favourite sport.
***
[I'm fascinated by this, since I've never participated personally, and don't "get" it.]
Tuesday, December 12, 2017
With 2020 Census Looming, Worries About Fairness and Accuracy
From the New York Times:
 Census experts and public officials are expressing growing concerns that the bedrock mission of the 2020 census — an accurate and trustworthy head count of everyone in the United States — is imperiled, with worrisome implications.
Preparations for the count already are complicated by a sea change in the census itself: For the first time, it will be conducted largely online instead of by mail.
But as the Census Bureau ramps up its spending and workforce for the 2020 count, it is saddled with problems. Its two top administrative posts are filled by placeholders. Years of underfunding by Congress and cost overruns on the digital transition have forced the agency to pare back its preparations, including abandoning two of the three trial runs of the overhauled census process.
Civil liberties advocates also fear that the Trump administration is injecting political considerations into the bureau, a rigidly nonpartisan agency whose population count will be the basis for redrawing congressional and state legislative districts in the early 2020s. And there is broad agreement that the administration’s aggressive enforcement of immigration policies will make it even harder to reach minorities, undocumented immigrants and others whose numbers have long been undercounted.
Taken together, some experts say, those issues substantially raise the risk that the 2020 count could be flawed, disputed, or both.

Preparations for the count already are complicated by a sea change in the census itself: For the first time, it will be conducted largely online instead of by mail.
But as the Census Bureau ramps up its spending and workforce for the 2020 count, it is saddled with problems. Its two top administrative posts are filled by placeholders. Years of underfunding by Congress and cost overruns on the digital transition have forced the agency to pare back its preparations, including abandoning two of the three trial runs of the overhauled census process.
Civil liberties advocates also fear that the Trump administration is injecting political considerations into the bureau, a rigidly nonpartisan agency whose population count will be the basis for redrawing congressional and state legislative districts in the early 2020s. And there is broad agreement that the administration’s aggressive enforcement of immigration policies will make it even harder to reach minorities, undocumented immigrants and others whose numbers have long been undercounted.
Taken together, some experts say, those issues substantially raise the risk that the 2020 count could be flawed, disputed, or both.
Monday, December 11, 2017
Debt in America: An Interactive Map

Credit can be a lifeline during emergencies and a bridge to education and homeownership. But debt—which can stem from credit or unpaid bills—often burdens families and communities and exacerbates wealth inequality. This map shows the geography of debt in America at the national, state, and county levels. How does your community compare?
This dashboard contains 2016 data derived from a random sample of deidentified, consumer-level records from a major credit bureau, as well as estimates from summary tables of the US Census Bureau’s American Community Survey (2015 or 2011–15).
We define the nonwhite population as those who are African American, Hispanic, Asian or Pacific Islander, American Indian or Alaska Native, another race, or multiracial.
Debt in collections includes past-due credit lines that have been closed and charged-off on their books as well as unpaid bills reported to the credit bureaus that the creditor is attempting to collect. For example, credit card accounts enter collections status once they are 180 days past due.
Subscribe to:
Posts (Atom)