Here's the link to the video recording of a lecture that Michael Ratcliffe, Census Bureau, gave two years ago in a distance learning class organized by Cornell. The topic concerns how the Census Bureau classifies political and statistical geographic entities.
The first 1 hour and 25 minutes are Michael's presentation, and the remainder is second half of the class in which Lars Vilhuber, Cornell, deals with citations in scholarly work—especially citing data. If metadata is your thing you may want to view that lecture as well.
Sunday, February 22, 2015

Saturday, February 21, 2015
Map of 73 Years of Lynchings
From the New York Times:
The most recent data on lynching, compiled by the Equal Justice Initiative, shows premeditated murders carried out by at least three people from 1877 to 1950 in 12 Southern states. The killers claimed to be enforcing some form of social justice. The alleged offenses that prompted the lynchings included political activism and testifying in court.
The most recent data on lynching, compiled by the Equal Justice Initiative, shows premeditated murders carried out by at least three people from 1877 to 1950 in 12 Southern states. The killers claimed to be enforcing some form of social justice. The alleged offenses that prompted the lynchings included political activism and testifying in court.
Friday, February 20, 2015
8 Million Metric Tons of Plastic Dumped Into World’s Oceans Each Year
We’ve been hearing for years about all the plastic that is going into our oceans, creating enormous gyres, washing up on beaches, threatening marine life and marine ecosystems in ways we don’t even know yet. A study last year called Valuing Plastic by the Plastic Disclosure Project and Trucost, estimated plastic caused about $13 billion in damages to marine ecosystems each year—and noted that that estimate was probably low, given what we don’t know yet.
A new study, Plastic waste inputs from land into the ocean, published in the journal Science last week, estimated that plastic debris washing into the ocean from 192 coastal countries reached somewhere between 4.8 and 12.7 million metric tons in 2010. That’s enough to cover every foot of coastline in the world.
More from Nation of Change.
A new study, Plastic waste inputs from land into the ocean, published in the journal Science last week, estimated that plastic debris washing into the ocean from 192 coastal countries reached somewhere between 4.8 and 12.7 million metric tons in 2010. That’s enough to cover every foot of coastline in the world.
More from Nation of Change.
Thursday, February 19, 2015
Occupational injuries, illnesses, and fatalities in public transportation
Injuries and illnesses to bus drivers endanger not only their lives but also the lives of their passengers. In 2013, approximately 5,780 transit and intercity bus drivers experienced a days-away-from-work injury or illness while on the job.
This article from the Bureau of Labor Statistics explores occupational injuries, illnesses, and fatalities to bus drivers and urban transit workers and examines how individual transit systems are collecting and analyzing their own employee safety data. The findings reveal that mass transit systems have taken steps to protect their employees from harm on the job and that injuries and illnesses to bus drivers and urban transit workers have declined in recent years.
This article from the Bureau of Labor Statistics explores occupational injuries, illnesses, and fatalities to bus drivers and urban transit workers and examines how individual transit systems are collecting and analyzing their own employee safety data. The findings reveal that mass transit systems have taken steps to protect their employees from harm on the job and that injuries and illnesses to bus drivers and urban transit workers have declined in recent years.
Wednesday, February 18, 2015
New EPA Regulations Would Ban Most Woodstove Models
From the Schoharie News:
For many in the area, woodstoves are a vital source of primary or secondary heat. The ample forests and thriving timber industry of Upstate New York provide a somewhat inexpensive and always available fuel.
However, for many residents dependent on the heat source this winter, things could change rapidly. The EPA is phasing in a five year program intended to reduce soot particulates in the air over the next five years...
Within 60 days of the February 3rd decision all new non-EPA approved stoves must produce 4.5 grams of particulates or less. The EPA will allow all current woodstove stock to be sold through the end of the calendar year.
The EPA is also including an enforcement mechanism to ensure the rules are being followed...
It is estimated that 80% of current wood stoves would not meet the current regulation. While current stoves are not included for destruction, New York state is going above and beyond. The state joined with several others calling similar EPA moves inadequate and together are suing for more stringent regulations on outdoor and indoor wood boilers.
For many in the area, woodstoves are a vital source of primary or secondary heat. The ample forests and thriving timber industry of Upstate New York provide a somewhat inexpensive and always available fuel.
However, for many residents dependent on the heat source this winter, things could change rapidly. The EPA is phasing in a five year program intended to reduce soot particulates in the air over the next five years...
Within 60 days of the February 3rd decision all new non-EPA approved stoves must produce 4.5 grams of particulates or less. The EPA will allow all current woodstove stock to be sold through the end of the calendar year.
The EPA is also including an enforcement mechanism to ensure the rules are being followed...
It is estimated that 80% of current wood stoves would not meet the current regulation. While current stoves are not included for destruction, New York state is going above and beyond. The state joined with several others calling similar EPA moves inadequate and together are suing for more stringent regulations on outdoor and indoor wood boilers.
Tuesday, February 17, 2015
Human Rights Watch World Report 2015
World Report 2015 is Human Rights Watch’s 25th annual review of human rights practices around the globe. It summarizes key human rights issues in more than 90 countries and territories worldwide, drawing on events from the end of 2013 through November 2014.
The book is divided into two main parts: an essay section, and country-specific chapters.
Individual country entries, each of which identifies significant human rights issues, examines the freedom of local human rights defenders to conduct their work, and surveys the response of key international actors, such as the UN, the European Union, the US, and various regional and international organizations and institutions.
See the full report HERE.
The book is divided into two main parts: an essay section, and country-specific chapters.
Individual country entries, each of which identifies significant human rights issues, examines the freedom of local human rights defenders to conduct their work, and surveys the response of key international actors, such as the UN, the European Union, the US, and various regional and international organizations and institutions.
See the full report HERE.
Monday, February 16, 2015
Finding publicly traded companies, filtered by state,
To find publicly traded companies filtered by state, check out NASDAQ's lists of companies by state. Lists of companies can be filtered by name, region, and industry. You can also search by stock exchange (NASDAQ, NYSE, AMEX) and by market cap.
Friday, February 13, 2015
Valentine's Day 2015: Feb. 14
|

Thursday, February 12, 2015
Which President Was Driven to Congress in Al Capone’s Armored Limousine?
Answer: Franklin Roosevelt! The Secret Service needed a car to drive President Roosevelt to Congress to make his speech on Pearl Harbor the day after the attack. The Treasury Department had impounded Al Capone's armored car years earlier, so they decided that was the safest transportation.
To celebrate President’s Day (February 16) and George Washington’s birthday (February 22), USA.gov put together a list of resources, activities, and lesson plans.
- Presidential Trivia - for younger kids
- Activity: Presidential Portraits Game
- Activity: Name the Presidents Game
- Activity: Presidential Trivia Quiz
- Lesson Plans: American Presidency
Wednesday, February 11, 2015
Long Island's Future: Economic Implications of Today's Choices
The Long Island Index released a report suggesting ways to improve Long Island’s economy and housing options. Accompanying the report is an interactive map that Steven Romalewski, Director, CUNY Mapping Service, and the team at the CUNY Graduate Center developed that provides historical context for the report, showing demographic change throughout Long Island over a 40 year period: 1970-2010.
The report is available at the Index’s website and the interactive maps are available here.
The report is available at the Index’s website and the interactive maps are available here.
Tuesday, February 10, 2015
That website John Oliver told you about: how much money Big Pharma has given your doctor?
On This Week Tonight, watch John Oliver eviscerate the stunningly corrupt practices of Big Pharma. This IS journalism. In the piece, he directs people to Open Payments, which is "a federal program that annually collects and makes information public about financial relationships between the health care industry, physicians, and teaching hospitals.
"The Centers for Medicare & Medicaid Services (CMS) collects information from manufacturers of drugs and devices about payments and other transfers of value they make to physicians and teaching hospitals. These payments and other transfers of value can be for many purposes, like research, consulting, travel, and gifts. CMS will be making this data publicly available each reporting year.
In other words, in the words of Mark Evanier, "you can look up your doctor and see how much loot he's taken and from whom."
"The Centers for Medicare & Medicaid Services (CMS) collects information from manufacturers of drugs and devices about payments and other transfers of value they make to physicians and teaching hospitals. These payments and other transfers of value can be for many purposes, like research, consulting, travel, and gifts. CMS will be making this data publicly available each reporting year.
In other words, in the words of Mark Evanier, "you can look up your doctor and see how much loot he's taken and from whom."
Monday, February 9, 2015
What is the best source for US house electoral data by districts?
One of the sources of House of Representative election data is the House website. However there's only data from 1920-2010. This citation is on a list from the Library of Congress.
The Federal Election Commission has data from 1982 through 2012.
There are other sources that involve paying for the information.
The Federal Election Commission has data from 1982 through 2012.
There are other sources that involve paying for the information.
Sunday, February 8, 2015
Every Country's Highest Valued Export
Which export makes your country the most money? Today's map comes from Simran Khosla at Global Post, who used data from the CIA Factbook to label each country by its highest valued export.
See the maps atMental Floss.
See the maps atMental Floss.
Friday, February 6, 2015
State Government Revenues Exceed Expenditures in 2013
|

Thursday, February 5, 2015
American War and Military Operations Casualties: Statistics
From Congressional Research Service via Federation of American Scientists
This report provides U.S. war casualty statistics. It includes data tables containing the number of casualties among American military personnel who served in principal wars and combat actions from 1775 to the present. It also includes data on those wounded in action and information such as race and ethnicity, gender, branch of service, and cause of death. The tables are compiled from various Department of Defense (DOD) sources.
Wars covered include the Revolutionary War, the War of 1812, the Mexican War, the Civil War, the Spanish-American War, World War I, World War II, the Korean War, the Vietnam Conflict, and the Persian Gulf War. Military operations covered include the Iranian Hostage Rescue Mission; Lebanon Peacekeeping; Urgent Fury in Grenada; Just Cause in Panama; Desert Shield and Desert Storm; Restore Hope in Somalia; Uphold Democracy in Haiti; and the ongoing Operation Enduring Freedom (OEF), Operation Iraqi Freedom (OIF), Operation New Dawn (OND), and Operation Inherent Resolve.
For the more recent conflicts, starting with the Korean War, the report includes additional detailed information on types of casualties and, when available, demographics.
This report provides U.S. war casualty statistics. It includes data tables containing the number of casualties among American military personnel who served in principal wars and combat actions from 1775 to the present. It also includes data on those wounded in action and information such as race and ethnicity, gender, branch of service, and cause of death. The tables are compiled from various Department of Defense (DOD) sources.
Wars covered include the Revolutionary War, the War of 1812, the Mexican War, the Civil War, the Spanish-American War, World War I, World War II, the Korean War, the Vietnam Conflict, and the Persian Gulf War. Military operations covered include the Iranian Hostage Rescue Mission; Lebanon Peacekeeping; Urgent Fury in Grenada; Just Cause in Panama; Desert Shield and Desert Storm; Restore Hope in Somalia; Uphold Democracy in Haiti; and the ongoing Operation Enduring Freedom (OEF), Operation Iraqi Freedom (OIF), Operation New Dawn (OND), and Operation Inherent Resolve.
For the more recent conflicts, starting with the Korean War, the report includes additional detailed information on types of casualties and, when available, demographics.
Wednesday, February 4, 2015
Census Bureau planning to discontinue the production of all 3-year ACS data
The Census Bureau is planning to discontinue the production of all 3-year American Community Survey data, according to their budget justification document:
"The Census Bureau proposes to terminate permanently the “3-Year Data” Product. The Census Bureau intended to produce this data product for a few years when the ACS was a new survey. Now that the ACS has collected data for nearly a decade, this product can be discontinued without serious impacts on the availability of the estimates for these communities."
See page 110 of 190, or page CEN-106 of US Census Budget estimates for FY 2016.
The elimination of the 3-yr ACS data products must be approved by OMB before it becomes official.
"The Census Bureau proposes to terminate permanently the “3-Year Data” Product. The Census Bureau intended to produce this data product for a few years when the ACS was a new survey. Now that the ACS has collected data for nearly a decade, this product can be discontinued without serious impacts on the availability of the estimates for these communities."
See page 110 of 190, or page CEN-106 of US Census Budget estimates for FY 2016.
The elimination of the 3-yr ACS data products must be approved by OMB before it becomes official.
Tuesday, February 3, 2015
Literally every goat in the United States
From the Washington Post, where there is an interactive map:
There were 2,621,514 goats in the United States as of 2012, the year of the most recent USDA Agricultural Census. If America's goats were their own state, its population would be larger than that of Wyoming, Vermont, D.C. and North Dakota -- combined.
You might say that goats are having a moment. NPR's new-ish blog on "stories of life in a changing world" is called "Goats and Soda," a nod to the animal's ubiquity in many parts of the developing world. Closer to home, goats are being used in urban areas to trim grass and control brush.
[There were 506 goats in Albany County, NY but none in the Bronx, alas.]
There were 2,621,514 goats in the United States as of 2012, the year of the most recent USDA Agricultural Census. If America's goats were their own state, its population would be larger than that of Wyoming, Vermont, D.C. and North Dakota -- combined.
You might say that goats are having a moment. NPR's new-ish blog on "stories of life in a changing world" is called "Goats and Soda," a nod to the animal's ubiquity in many parts of the developing world. Closer to home, goats are being used in urban areas to trim grass and control brush.
[There were 506 goats in Albany County, NY but none in the Bronx, alas.]
Monday, February 2, 2015
Our Eroded Mental Healthcare System
Americans like to talk about crises. Well there’s a massive crisis that’s being overlooked.
In our own heads, our schools, on our streets, and in our jails.
61.5 million American adults experience mental illness in a given year
13.6 million have serious mental illness:
Schizophrenia
Major depression
or Bipolar disorder
60% of which have an unmet need for mental healthcare
More from HERE.
In our own heads, our schools, on our streets, and in our jails.
61.5 million American adults experience mental illness in a given year
13.6 million have serious mental illness:
Schizophrenia
Major depression
or Bipolar disorder
60% of which have an unmet need for mental healthcare
More from HERE.
Sunday, February 1, 2015
The Effects of High Cholesterol on the Body
Our bodies need healthy levels of cholesterol to function. Cholesterol is a fatty substance made by the liver and distributed throughout the body. It allows our bodies to make vitamin D and hormones, and makes up bile acids. We also get less than 25 percent of our body’s cholesterol from the foods we eat, especially animal fats.
High cholesterol means you have a lot more cholesterol in your blood than you need. Most people who have high cholesterol don’t have any obvious symptoms. A simple blood test can tell you if you have high cholesterol. If you do have high cholesterol, dietary changes, exercise, and targeted medications can help lower it and reduce your risk of developing heart disease.
See more at Heathline
High cholesterol means you have a lot more cholesterol in your blood than you need. Most people who have high cholesterol don’t have any obvious symptoms. A simple blood test can tell you if you have high cholesterol. If you do have high cholesterol, dietary changes, exercise, and targeted medications can help lower it and reduce your risk of developing heart disease.
See more at Heathline
Saturday, January 31, 2015
Facts for Features: Super Bowl XLIX: Feb. 1, 2015
Super Bowl XLIX will be played Feb. 1 at University of Phoenix Stadium in Glendale, Ariz. This will be the second time the NFL’s championship game will be held in Glendale and the third time in the Phoenix metropolitan area. To commemorate this event, the Census Bureau has compiled a collection of facts examining the demographics of the host metropolitan area, as well as the metro areas represented by the two participants — the New England Patriots and the Seattle Seahawks.
Go to <http://quickfacts.census.gov> for more statistics about the cities involved. Unless otherwise noted, all comparisons are statistically significant at the 0.10 level.
New England (Patriots)
10th
Where Boston ranked on the list of the nation’s most populous metropolitan areas. The estimated population of the Boston-Cambridge-Newton, Mass.-N.H., metro area on July 1, 2013, was 4,684,299. The Boston metro area gained 42,204 people from July 1, 2012, to July 1, 2013. At the time of the Patriots’ first season in 1960, the 1960 Census population for the city of Boston was 697,197. Source: Census Population Estimates and Decennial Census <http://factfinder.census.gov/
44.8%
Percentage of Boston metro area residents 25 and older who had a bachelor’s degree or higher in 2013
Friday, January 30, 2015
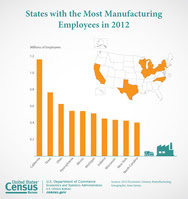
New York State ranks third in Manufacturing Employment for 2012
|
Wednesday, January 28, 2015
One in Five Children Receive Food Stamps
|

Tuesday, January 27, 2015
Black (African-American) History Month: February 2015
To commemorate and celebrate the contributions to our nation made by people of African descent, American historian Carter G. Woodson established Black History Week. The first celebration occurred on Feb. 12, 1926. For many years, the second week of February was set aside for this celebration to coincide with the birthdays of abolitionist/editor Frederick Douglass and Abraham Lincoln. In 1976, as part of the nation’s bicentennial, the week was expanded into Black History Month. Each year, U.S. presidents proclaim February as National African-American History Month.
Population
45.0 million
The number of blacks, either alone or in combination with one or more other races, on July 1, 2013,up 1.0 percent from July 1, 2012. Source: Population Estimates <http://factfinder2.census.
Monday, January 26, 2015
Ranking America
Mark Rice, who teaches American studies at St. John Fisher College in Rochester, N.Y., said students often arrived at his classes steeped in the notion that the United States excelled at everything. He started a blog, Ranking America, to challenge their assumptions with a wild assortment of country comparisons, some sober (the United States is No. 1 in small arms ownership) and others less so (the United States is tied for 24th with Nigeria in frequency of sex).
(Excerpt from the New York Times)
(Excerpt from the New York Times)
Sunday, January 25, 2015
Pew Explains Why the Conservatives Live in Their Own “Reality”
The Pew Research group has a great reputation for non-partisan and accurate public polling and political analysis. In fact, it was tied as the most accurate polling organization in the 2012 elections. Given their history of success, it is reasonable to have confidence in the results of their polling, particularly in issues where partisanship is an issue.
[In November], Pew released an exceptional report, detailing the news media habits of Americans based upon their partisan affiliation. Pew polled a large number of Americans to determine their political leanings and news consumption habits. The results of this study were, while not surprising, extremely revealing and informative.
The Pew study concluded that conservatives differ dramatically from liberals and moderates in their news media consumption habits. Moderates and liberals trust a much wider range of sources than conservatives. Similarly, from among the news sources that they trust, conservatives watch/listen to fewer sources while moderates and liberals access a much wider range.
More from the Progressive Cynic.
[In November], Pew released an exceptional report, detailing the news media habits of Americans based upon their partisan affiliation. Pew polled a large number of Americans to determine their political leanings and news consumption habits. The results of this study were, while not surprising, extremely revealing and informative.
The Pew study concluded that conservatives differ dramatically from liberals and moderates in their news media consumption habits. Moderates and liberals trust a much wider range of sources than conservatives. Similarly, from among the news sources that they trust, conservatives watch/listen to fewer sources while moderates and liberals access a much wider range.
More from the Progressive Cynic.
Saturday, January 24, 2015
The devastating impact of vaccine deniers, in one measles chart
There were 644 new measles cases in 27 states last year, according to the CDC. That's the biggest annual number we've seen in nearly a quarter-century. The vast majority of people who contracted the disease were unvaccinated, including the dozens of cases related to an outbreak at Disneyland in Orange County, California, which is basically Ground Zero in our current epidemic of anti-vaccine hysteria.
A 2014 AP-GfK survey found that only 51 percent of Americans were confident that vaccines are safe and effective, which is similar to the proportion who believe that houses can be haunted by ghosts.
But the latest CDC data illustrate the troubling resurgence of a disease that, as of 2000, had been declared eliminated.
See the chart from the Washington Post HERE.
A 2014 AP-GfK survey found that only 51 percent of Americans were confident that vaccines are safe and effective, which is similar to the proportion who believe that houses can be haunted by ghosts.
But the latest CDC data illustrate the troubling resurgence of a disease that, as of 2000, had been declared eliminated.
See the chart from the Washington Post HERE.
Guerrilla Public Service: An Unsanctioned Highway 5 Sign

In the early 1950s, the predecessor to the California Department of Transportation (colloquially "Caltrans") opened an innovative solution to Los Angeles' traffic problems at the junction of U.S. Route 101 and California Highway 110...
It looks like a mess but apparently, it's an improvement over what was there before. Nevertheless, there is always room for further improvement. For example, in 2000 and into 2001, the section of California Highway 110 leading into the Interchange had a problem -- inadequate signage, at least if you were hoping to get to Interstate 5 North...
It's hard to read, but the sign says that if you want Interstate 5 North, you want to be in the left three lanes on a five-lane highway. It's easy to miss, and if you do, you're probably going to be in the wrong lane until it's too late.
That was the experience of a man named Richard Ankrom, at least. In 2000 or 2001, he missed his exit and, frustrated, decided to do something about it. But unlike most people, who would complain (probably fruitlessly) to Caltrans or a government official, Ankrom took matters into his own hands. Ankrom is an artist -- and in this case, his masterpiece was a new sign...
Friday, January 23, 2015
Release of 2014 U.S. and State Population Estimates
July 1, 2014 population estimates are now available for the nation, states and Puerto Rico on American FactFinder. The annual estimates include components of change (births, deaths and net migration) in the previous year and since the April 1, 2010 Census. The estimates were originally released on Dec. 23, 2014, on the Population and Housing Unit Estimates website (http://www.census.
In addition, new monthly estimates are now available for the nation for April 1, 2010 to Jan. 1, 2015. These monthly estimates are for the resident population, resident population plus armed forces overseas, civilian population, civilian noninstitutionalized population and household population.
In addition, new monthly estimates are now available for the nation for April 1, 2010 to Jan. 1, 2015. These monthly estimates are for the resident population, resident population plus armed forces overseas, civilian population, civilian noninstitutionalized population and household population.
Thursday, January 22, 2015
60 Years of Urban Change
From the Institute for Quality Communities - click this LINK:
60 years has made a big difference in the urban form of American cities. The most rapid change occurred during the mid-century urban renewal period that cleared large tracts of urban land for new highways, parking, and public facilities or housing projects. Fine-grained networks of streets and buildings on small lots were replaced with superblocks and megastructures. While the period did make way for impressive new projects in many cities, many of the scars are still unhealed.
We put together these sliders to show how cities have changed over half a century.
In this post, we look at the historic cities of the Northeast.
See also links to more then-and-now sliders: Oklahoma and Texas | Midwest | Southeast
60 years has made a big difference in the urban form of American cities. The most rapid change occurred during the mid-century urban renewal period that cleared large tracts of urban land for new highways, parking, and public facilities or housing projects. Fine-grained networks of streets and buildings on small lots were replaced with superblocks and megastructures. While the period did make way for impressive new projects in many cities, many of the scars are still unhealed.
We put together these sliders to show how cities have changed over half a century.
In this post, we look at the historic cities of the Northeast.
See also links to more then-and-now sliders: Oklahoma and Texas | Midwest | Southeast
Wednesday, January 21, 2015
Technology's Impact on Workers
The internet and cell phones have infiltrated every cranny of American workplaces, and digital technology has transformed vast numbers of American jobs. Work done in the most sophisticated scientific enterprises, entirely new technology businesses, the extensive array of knowledge and media endeavors, the places where crops are grown, the factory floor, and even mom-and-pop stores has been reshaped by new pathways to information and new avenues of selling goods and services. For most office workers now, life on the job means life online.
Pew Research surveyed online a representative sample of adult internet users and asked those who have jobs a series of questions about the role of digital technology in their work lives. This is not a sample representative of all workers. It covers online adults who also have full- or part-time jobs in any capacity....
Email and the internet are deemed the most important communications and information tools among online workers.
The high value of email comes despite the challenges of the past generation, including threats like spam and phishing and competitors like social media and texting. Surprisingly, landline phones outrank cell phones for these internet-using workers. Social media is very low in importance....
While commentators worry that digital tools can be a distraction in the workplace, many online workers say that is not the case when it comes to their productivity.
Pew Research surveyed online a representative sample of adult internet users and asked those who have jobs a series of questions about the role of digital technology in their work lives. This is not a sample representative of all workers. It covers online adults who also have full- or part-time jobs in any capacity....
Email and the internet are deemed the most important communications and information tools among online workers.
The high value of email comes despite the challenges of the past generation, including threats like spam and phishing and competitors like social media and texting. Surprisingly, landline phones outrank cell phones for these internet-using workers. Social media is very low in importance....
While commentators worry that digital tools can be a distraction in the workplace, many online workers say that is not the case when it comes to their productivity.
Tuesday, January 20, 2015
Educational Attainment in the United States: 2014
This table package provides Current Population Survey statistics on academic achievement by demographic characteristics, such as age, sex and Hispanic origin. It also includes detailed information on years of school completed, showing how many years of education adults have completed for each level of attainment. A variety of historical time series tables going back to 1940 are also provided, as are graphs illustrating historical data.
Monday, January 19, 2015
African American History: More Than Civil Rights
When we teach African American history we discuss slavery and the fight for equality. These are essential conversations, but there is so much more than that. African Americans have made significant contributions in all fields of study, including science and technology, the arts, and medicine. This February, we celebrate African American History month. We’ve provided a list of resources that discuss the fundamentals of African American history and a few that highlight achievements in the arts and sciences:
- Guide: African-American Mosaic
- Lesson Plan: Revolution '67: Protest: Why and How
- Videos: Civil Rights - National Archives
Friday, January 16, 2015
2014 Was Hottest Year on Earth in Recorded History
|
Thursday, January 15, 2015
Annual Report of the Office of Economic Research, FY 2014
The Office of Advocacy has released the Annual Report of the Office of Economic Research, FY 2014.
In fiscal year 2014, Advocacy produced 23 contract and internal research
reports on a variety of topics including access to capital, employment,
environment, minority-and women-owned businesses, procurement, retirement,
taxation and veterans. This annual report provides details about and a link to
each of OER's publications from FY 2014.
The full report can
be found on Advocacy's website here.
Tuesday, January 13, 2015
Five Healthy Resolutions You Won’t Regret Making In 2015
Raise your hand if you’re overly tired of hearing New Year’s resolutions about weight loss. Granted, we can’t see your hands and doubt that you’re actually glaring at the dim light of your computer screen holding five digits in the air, but there’s no doubting you can sympathize. Year after year, so many of us resolve to drop a few pounds and change our ways the moment the clock strikes midnight and whatever metallic New Year’s dress you wore ends up in the “drop off at the dry cleaner” pile.
The reality? There are better resolutions. Not discounting the benefits of weight loss. But, there are healthy things you can do to change your life that don’t revolve around numbers on a scale.
More from National Memo
The reality? There are better resolutions. Not discounting the benefits of weight loss. But, there are healthy things you can do to change your life that don’t revolve around numbers on a scale.
More from National Memo
Monday, January 12, 2015
Fracking: New Study Says It Not Only Pollutes Groundwater, But Poisons Air As Well
A new study says that the mining technique known as fracking, (aka frack sand mining or hydraulic fracturing) isn’t only a threat to drinkable groundwater supplies, but also might just make the air we breathe toxic.
***
In September, an air monitoring study in New York, Arkansas, Colorado, Ohio, Pennsylvania and Wyoming found high levels of toxic pollutants such as the banned carcinogens benzene and formaldehyde in communities near drilling sites. About 40 percent of the samples were above pollution concentrations considered unsafe by the federal government.
***
The study leader author, David Carpenter, is the director of the Institute of Health and the Environment at New York State University at Albany.
Read more at Inquistr
***
In September, an air monitoring study in New York, Arkansas, Colorado, Ohio, Pennsylvania and Wyoming found high levels of toxic pollutants such as the banned carcinogens benzene and formaldehyde in communities near drilling sites. About 40 percent of the samples were above pollution concentrations considered unsafe by the federal government.
***
The study leader author, David Carpenter, is the director of the Institute of Health and the Environment at New York State University at Albany.
Read more at Inquistr
Friday, January 9, 2015
2013 Annual Survey of Public Employment and Payroll
Provides a comprehensive look at the employment of the nation’s state and local governments, as well as the federal government. It shows the number of government civilian employees and their gross payroll by governmental function. These governmental functions include, for example, elementary and secondary education, and police protection. Internet address: <http://www2.census.gov/govs/
Thursday, January 8, 2015
Improved Search and QuickFacts Enhance Census Bureau’s Website
|

Wednesday, January 7, 2015
Vinyl Sales In 2014 See A 52 Percent Boost In U.S.
After surviving near-extinction last decade, vinyl made an exceptional global resurgence with purchases increasing more than sixfold. The U.S. continued this trend in 2014, seeing a 52 percent increase in LP purchases from 2013.
According to data collected by Digital Music News and Wall Street Journal via SoundScan and Nielsen ratings, 9.2 million vinyl albums were sold in 2014 -- the highest sales number recorded since the industry started monitoring LP sales in 1991. While 9.2 million albums only accounts for 6 percent of total album sales in the U.S. in 2014, streaming services saw an increase of 54 percent, jumping from 106 billion song streams in 2013 to 164 billion song streams in 2014.
On the other hand, paid downloads dropped by 9 percent for albums and 12 percent for songs.
More from Huffington Post, via the Wall Street Journal.
According to data collected by Digital Music News and Wall Street Journal via SoundScan and Nielsen ratings, 9.2 million vinyl albums were sold in 2014 -- the highest sales number recorded since the industry started monitoring LP sales in 1991. While 9.2 million albums only accounts for 6 percent of total album sales in the U.S. in 2014, streaming services saw an increase of 54 percent, jumping from 106 billion song streams in 2013 to 164 billion song streams in 2014.
On the other hand, paid downloads dropped by 9 percent for albums and 12 percent for songs.
More from Huffington Post, via the Wall Street Journal.
Tuesday, January 6, 2015
World Statistics Pocketbook 2014 edition
The World Statistics Pocketbook is an annual compilation of key economic, social and environmental indicators, presented in one-page profiles. This edition includes country profiles for 217 countries or areas of the world....
This issue of the World Statistics Pocketbook covers various years from 2005 to 2014. For the economic indicators, in general, three years - 2005, 2010 and 2012 - are shown, unless otherwise indicated. Due to space limitations, data for one year only are shown for the indicators in the social and environmental categories. For the six social indicators for which the range of years 2010-2015 is shown, the data refer to projections. When other ranges of years are shown, the data refer to the most recent year available within that range.
Direct link to document
This issue of the World Statistics Pocketbook covers various years from 2005 to 2014. For the economic indicators, in general, three years - 2005, 2010 and 2012 - are shown, unless otherwise indicated. Due to space limitations, data for one year only are shown for the indicators in the social and environmental categories. For the six social indicators for which the range of years 2010-2015 is shown, the data refer to projections. When other ranges of years are shown, the data refer to the most recent year available within that range.
Direct link to document
Monday, January 5, 2015
Mobility is Most Common Disability Among Older Americans
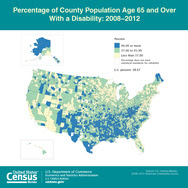
Nearly 40 percent of people age 65 and older had at least one disability, according to a U.S. Census Bureau report that covered the period 2008 to 2012. Of those 15.7 million people, two-thirds of them say they had difficulty in walking or climbing.
Difficulty with independent living, such as visiting a doctor’s office or shopping, was the second-most cited disability, followed by serious difficulty in hearing, cognitive difficulty, difficulty bathing or dressing, and serious difficulty seeing.
While populous states such as California, Florida, New York and Texas had the largest number of older people with a disability, high disability rates were seen in Southern counties, especially in central Appalachia and the Mississippi Delta.
Older Americans With a Disability: 2008-2012, a report based on data collected during the American Community Survey, examines disability status by age, sex and selected socio-economic characteristics, such as marital status, living arrangement, educational attainment and poverty status.
|
Friday, January 2, 2015
How Young Adults Today Compare With Previous Generations in Neighborhoods Nationwide

Young adults today, often called the millennial generation, are more likely to be foreign born and speak a language other than English at home, compared with young adults in 1980, according to the U.S. Census Bureau’s latest statistics from theAmerican Community Survey released today.
“Many of the differences between generations examined within these latest data reflect long-term demographic and societal changes,” said Jonathan Vespa, a Census Bureau demographer. “Three decades of decennial census statistics combined with the latest American Community Survey statistics give us a unique view of how — and where — our nation is changing. In this case, we can look at the changing characteristics of young adults over the last few decades.”
|
Thursday, January 1, 2015
Mapping Migration in the United States
The charts show striking patterns for many states: You can trace the rise of migrant and immigrant populations all along the Southwest, particularly in Texas and Arizona; the influx of New Yorkers and other Northeasterners into Florida starting in the 1970s; and the growth in the Southern share of the Illinois population during the Great Migration.
In 1900, 95 percent of the people living in the Carolinas were born there, with similarly high numbers all through the Southeast. More than a hundred years later, those percentages are nearly cut in half.
More from the New York Times.
In 1900, 95 percent of the people living in the Carolinas were born there, with similarly high numbers all through the Southeast. More than a hundred years later, those percentages are nearly cut in half.
More from the New York Times.
Subscribe to:
Posts (Atom)